Knowledge Base
Timescale, Density, and Folding on the Gantt
The whole programme, always on screen
The Gantt never scrolls sideways. Its day-to-pixel scale is the chart's own width divided by the programme's span, so the earliest activity sits at the left edge and the latest at the right whatever the settings. Scrolling is vertical only, through the rows.
That makes Timescale a choice of ruling rather than a zoom: Day, Week and Month change how finely the calendar is ticked, not how much of the programme you can see.
Day, Week, Month
Day rules one column per day, with the project's non-working days tinted.
Week rules one column per week, labelled with the date that week starts on. Weeks always start on a Monday, and the timeline is padded out to whole weeks at both ends so the columns land on real week boundaries.
Month rules one column per calendar month, each as wide as that month actually is. The band above it steps up to years, since the ticks already carry the month names.
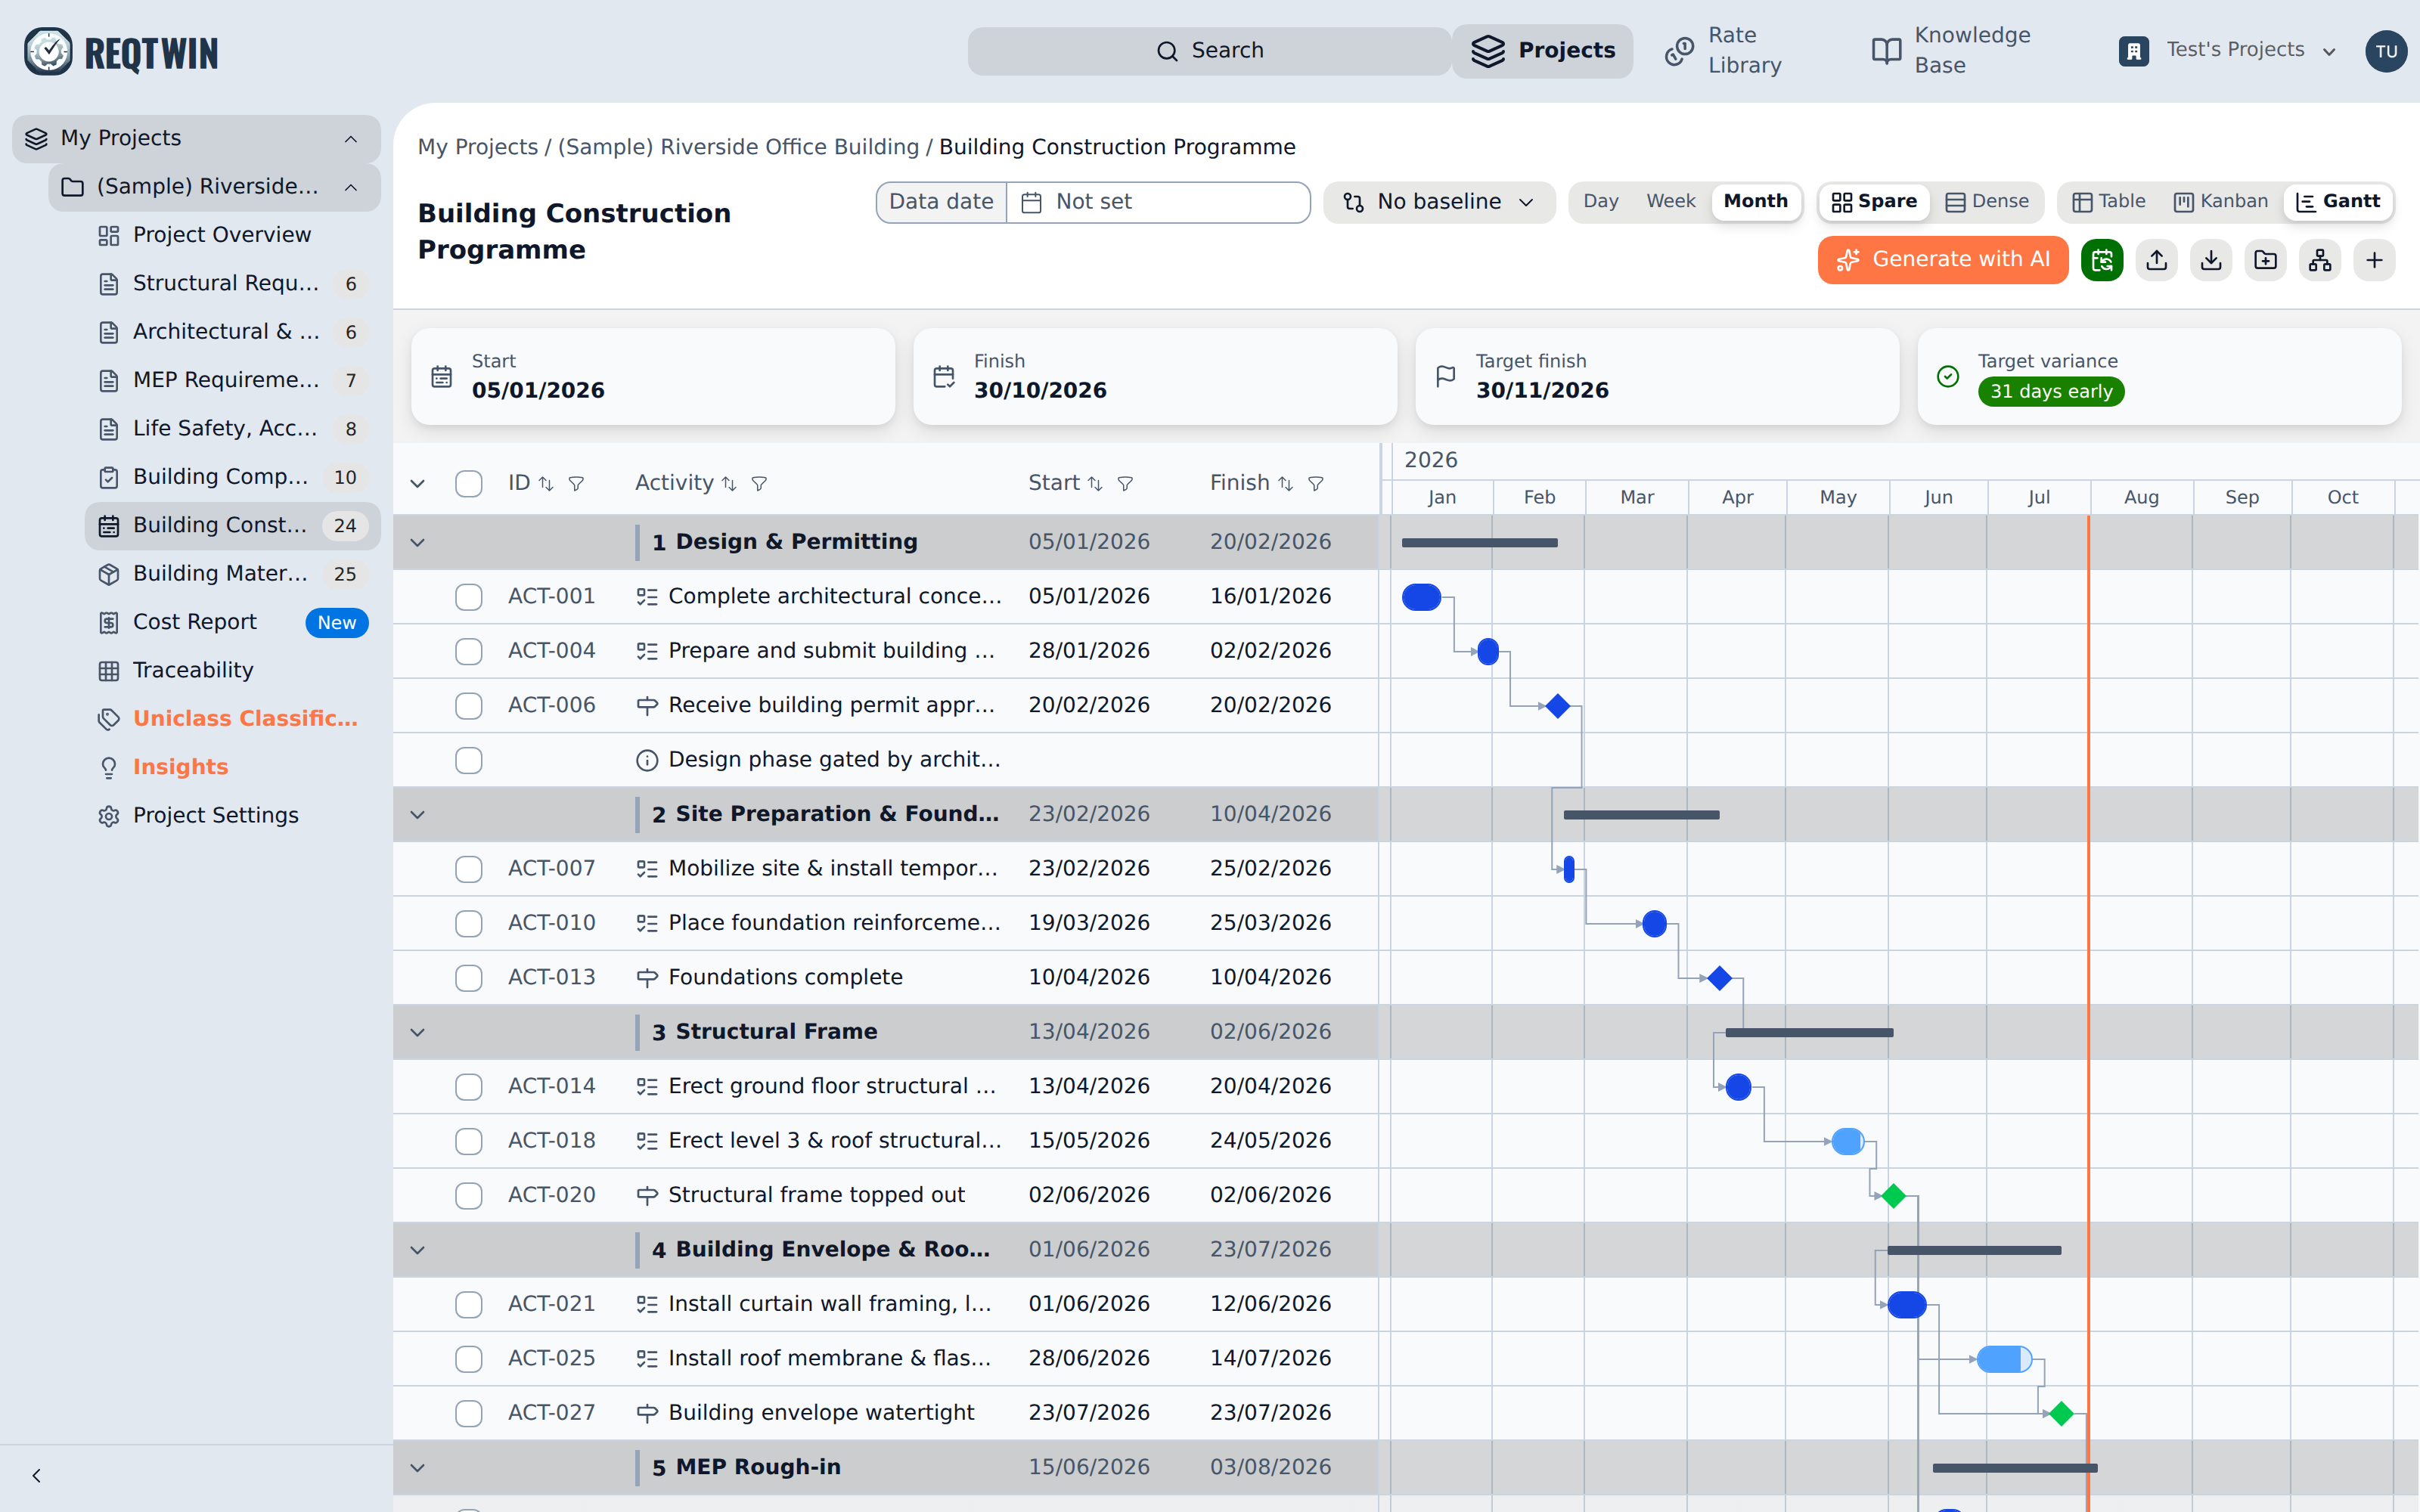
The same programme at the Month timescale: month ticks under a year band.
A unit whose columns would come out thinner than a hairline coarsens to the next one up, so on a year-long programme Day falls back to week columns, and on a longer one to months. The chart itself does not move; only the ruling changes. Labels drop out of any column too narrow to hold one.
Timescale is not remembered: reopening a programme starts at Week again. The Density toggle is remembered, along with the view mode. Spare and Dense set row height here as they do on the Table, and Dense fits roughly a quarter more rows on screen.
Turning the overlays off
Two toggles sit beside Timescale, both on to start with:
Relationships draws the dependency arrows between bars.
Non-working days shades the days the project's work calendar has nobody on site: the days off in its working week, plus its org and project holidays.
Both annotate the bars rather than being bars themselves, and on a long or crowded programme either can bury what it is annotating. An accented icon marks a layer that is on. Like Timescale, the choice is not remembered: reopening a programme brings both back.
Folding sections away
The chevron in the leftmost column folds every row beneath a WBS element away and leaves its summary bar behind, so a finished phase collapses to a single line that still shows the span it covered. Pressing the row anywhere else does the same thing, and also selects it. A nested WBS element carries its chevron beside its own name instead, next to the indent that says which element it sits under.
The chevron in that column's header folds or unfolds the whole programme at once, whatever the depth.
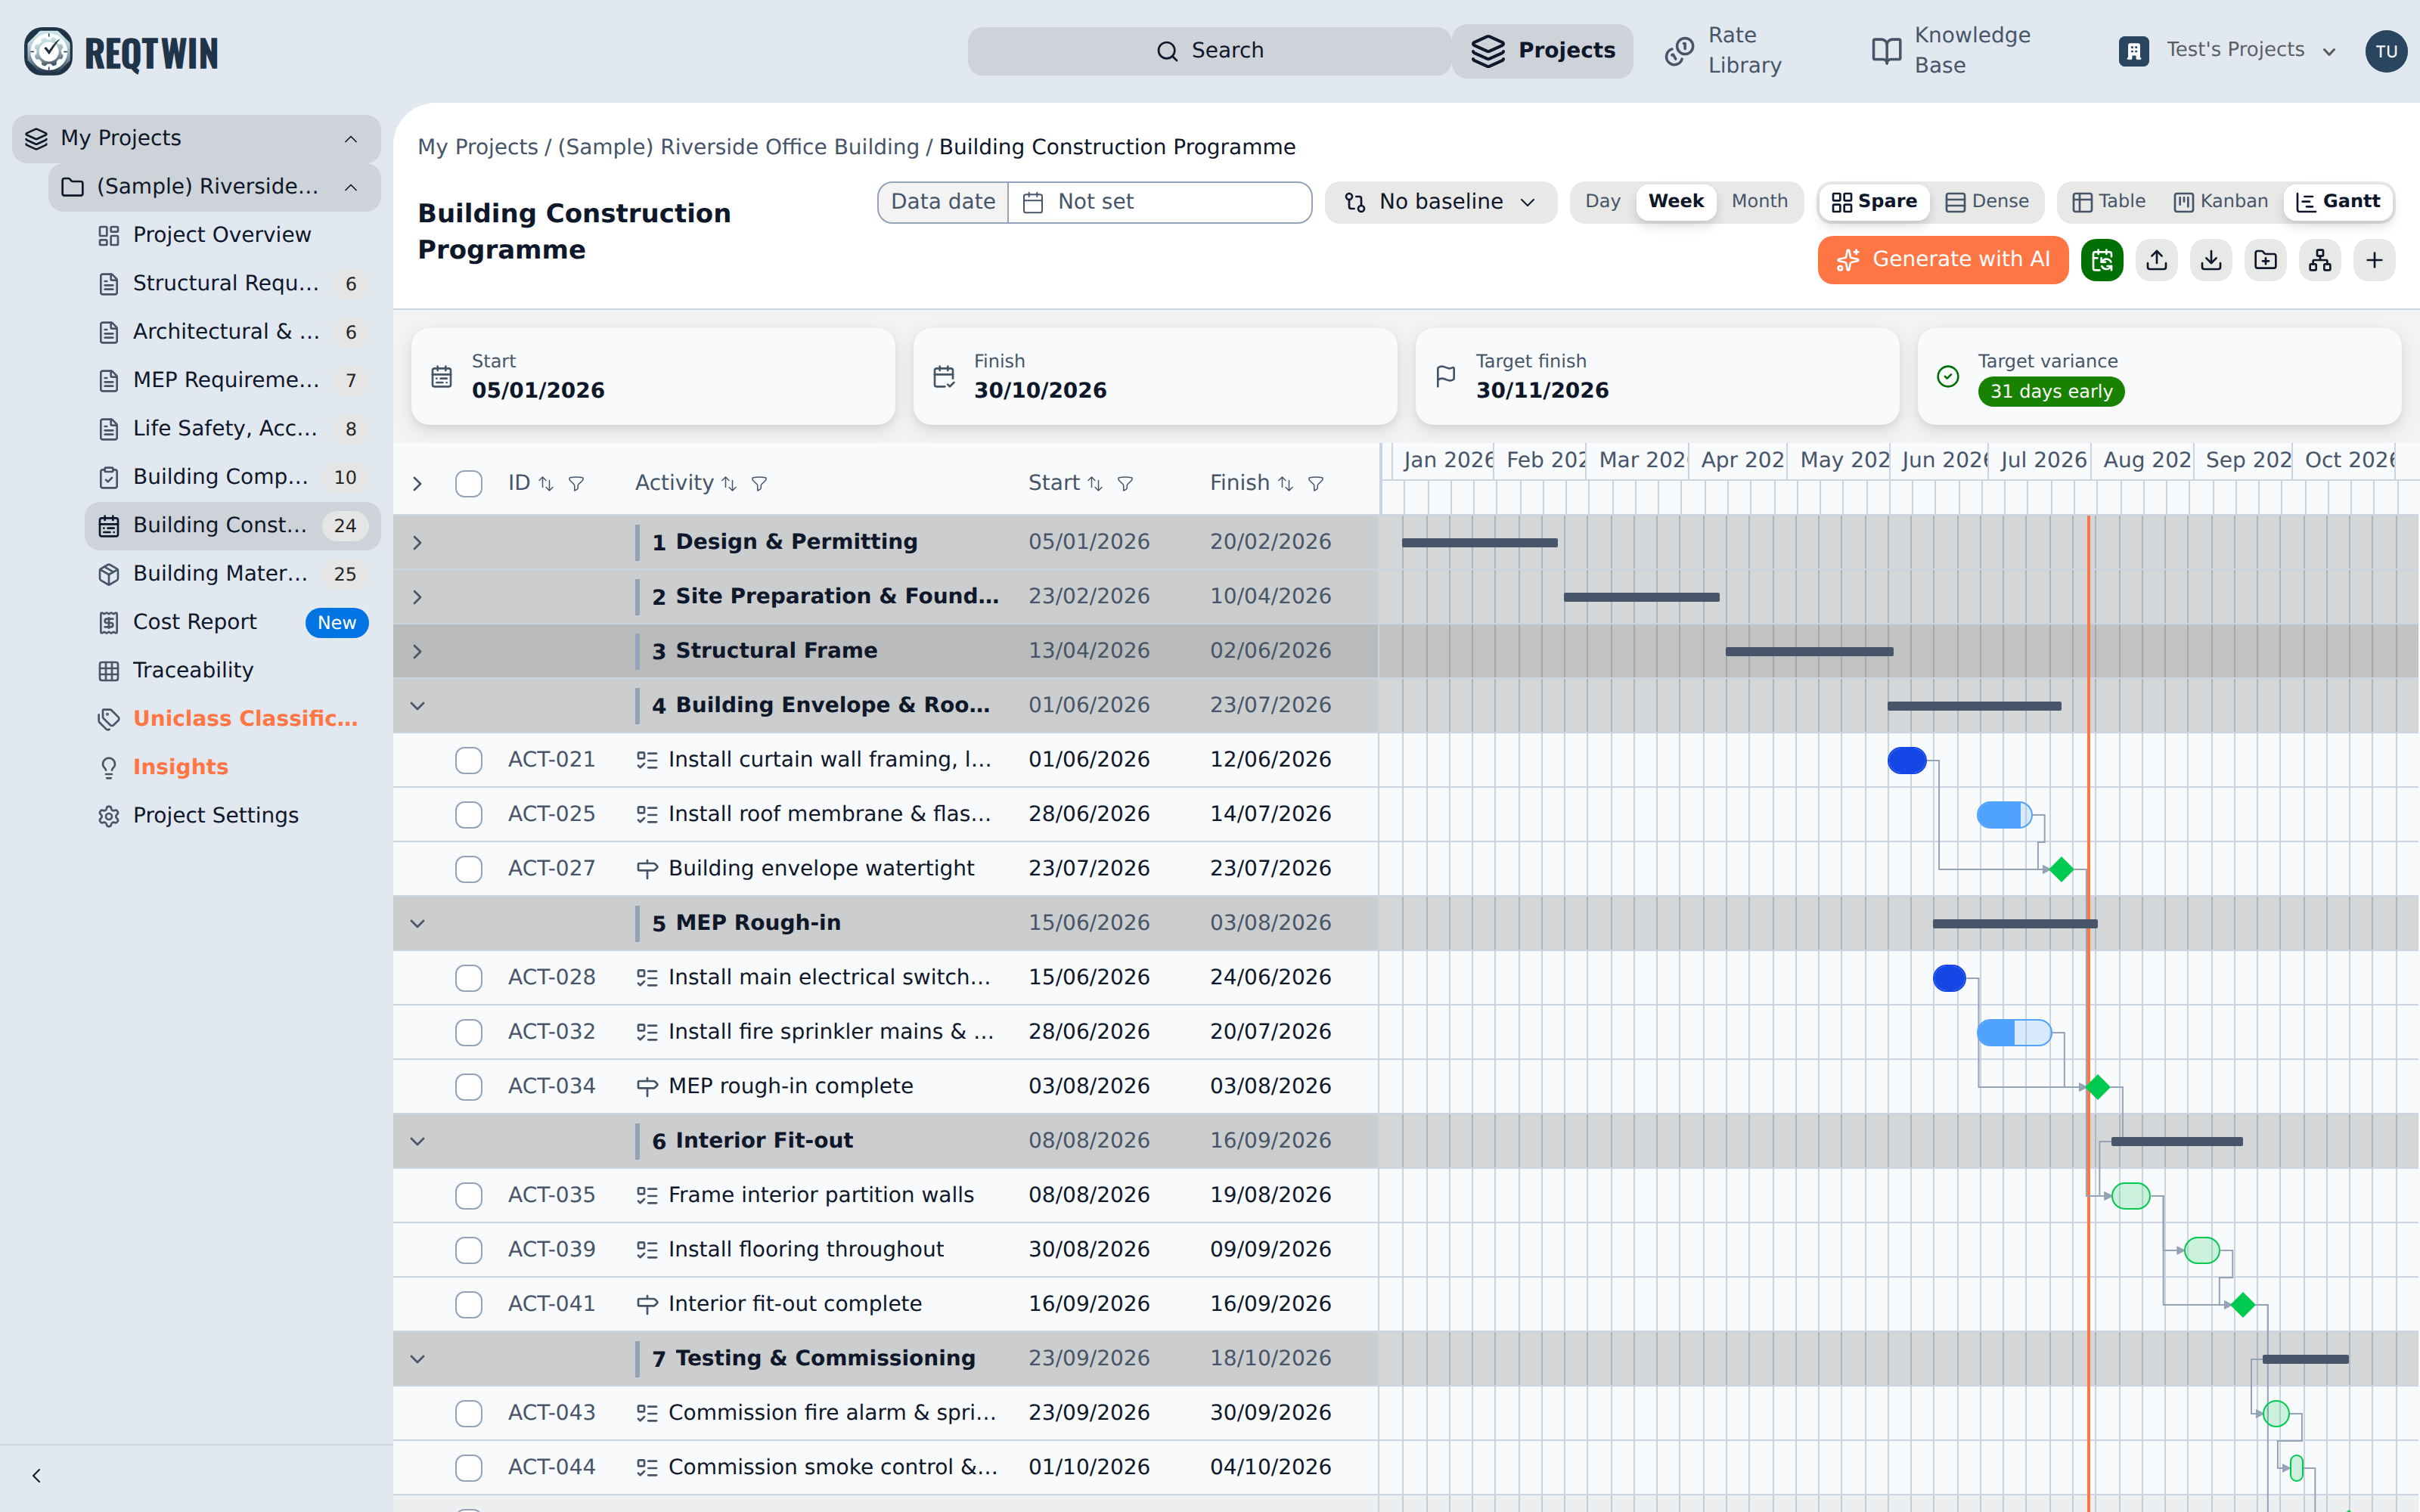
Three completed phases folded to their summary bars, with the live work below them.
Folding is shared with the Table view: a section collapsed in one is collapsed in the other for as long as the document stays open. It never rescales the chart either. The timeline is measured from every dated activity, folded-away ones included, so the bars that remain stay exactly where they were.
A column filter overrides folding while it is on, opening every section so a match is never hidden inside a folded one, and it does rescale the timeline to what is left (see "Reading the Programme Gantt"). The chevrons come off screen while it is on, since there is nothing left for them to fold. Clearing the filter restores whatever was folded.