Knowledge Base
Building a Cost Report
The report and its five views
A cost document is an outline, same shape as Requirements and ITP. Its headings are sections (Materials, Labour, Preliminaries) and the rows underneath are cost lines. Only a line carries money; a heading carries the subtotal of everything beneath it.
The switcher at the top right moves between five views of the same document, in the order the money moves through it: Estimate (the live report), Summary (its composition), Budget (a frozen revision), Actuals (spend recorded against it), and Variance (the difference). The Estimate view is the only one that edits the report; the others read it.
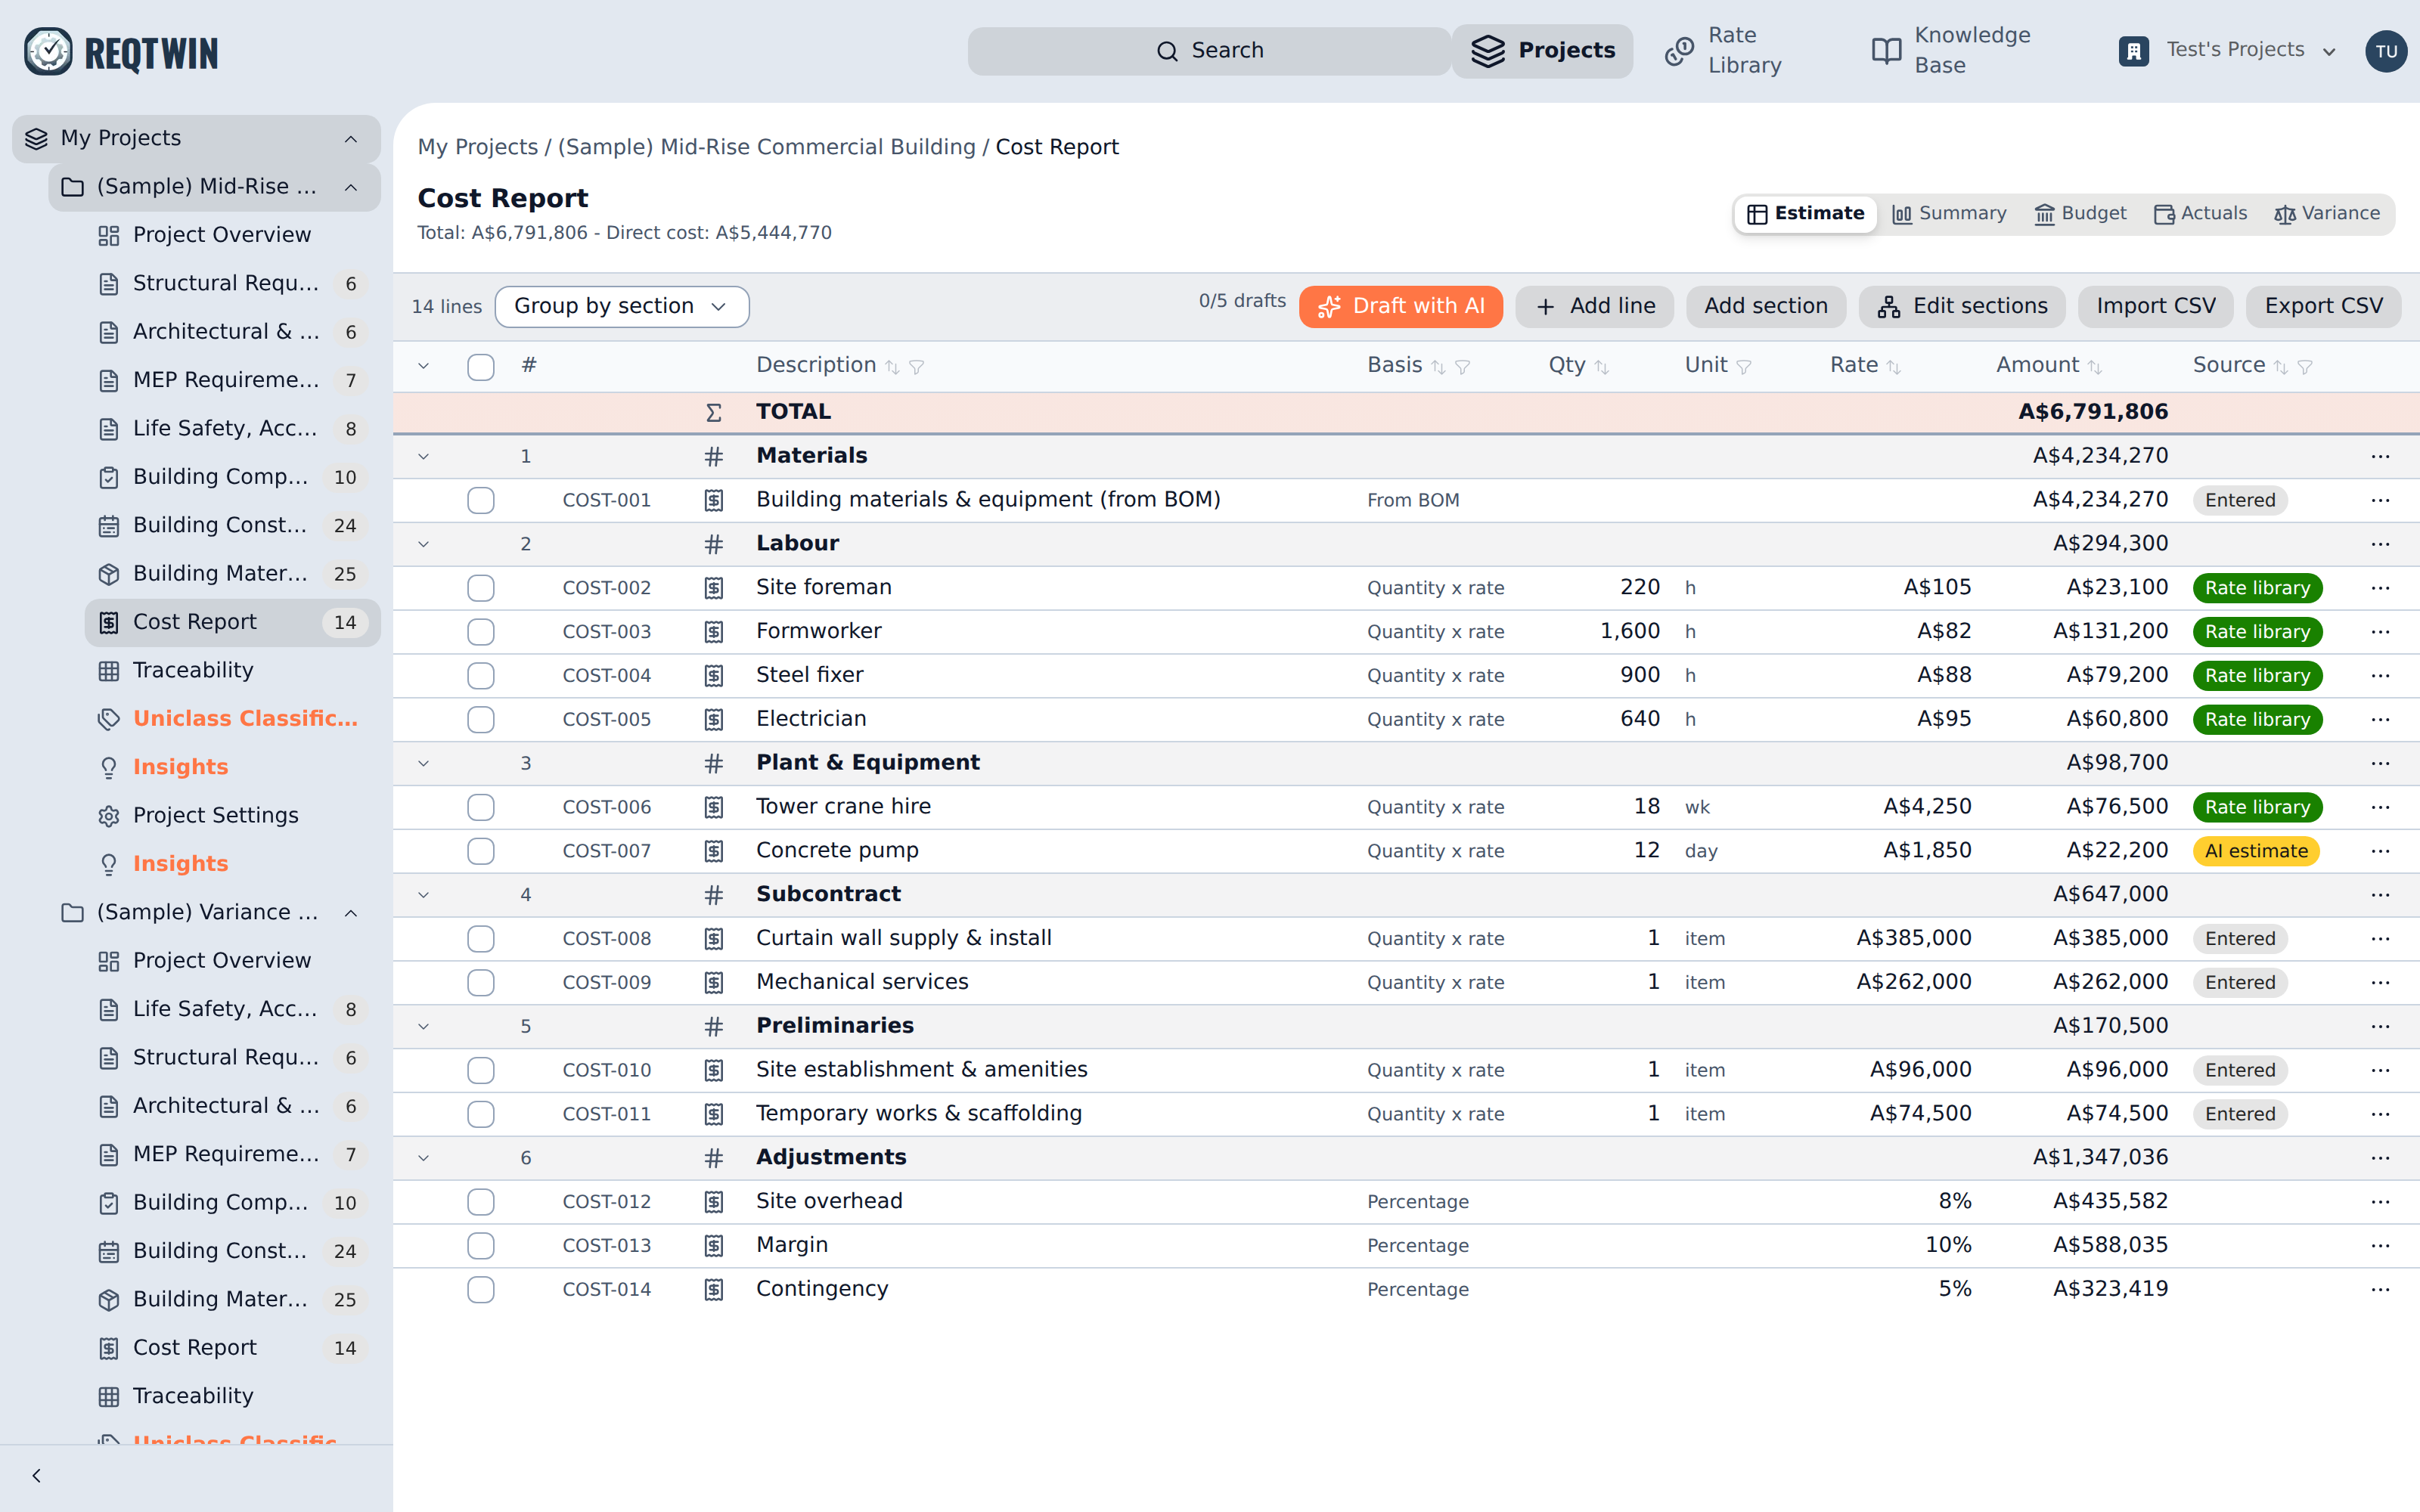
The Estimate view: sections, cost lines, and a frozen total above them.
The page opens on Variance once a budget revision is in use, and on Estimate before that.
How a line reaches its amount
Every line declares exactly one basis, which decides which of its fields mean anything:
Quantity x rate, the amount is quantity times rate. A lump sum is a quantity of 1 in the "item" unit.
Percentage, the amount is a percent of a base named on the line (see below).
From BOM, the amount is read live from a BOM document (optionally one area heading within it) every time the report is opened, so repricing a part in the BOM moves this line.
A percentage line also names what it is a percentage *of*: Direct cost (every non-percentage line in the document), Running subtotal (everything above the line in document order, earlier percentage lines included), or Section subtotal (the non-percentage lines under its nearest section). Only Running subtotal compounds, which is what lets margin apply on top of overhead.
Where a rate came from
The Source column records where each figure originated at the moment it was set: Entered by a person, Rate library if it was priced from your organisation's rate book, Benchmark if it was grounded in pooled market data, or AI estimate if the model priced it with nothing to ground against. It is provenance, not a quality score, and it stays true afterwards even if the library entry behind it is later removed.
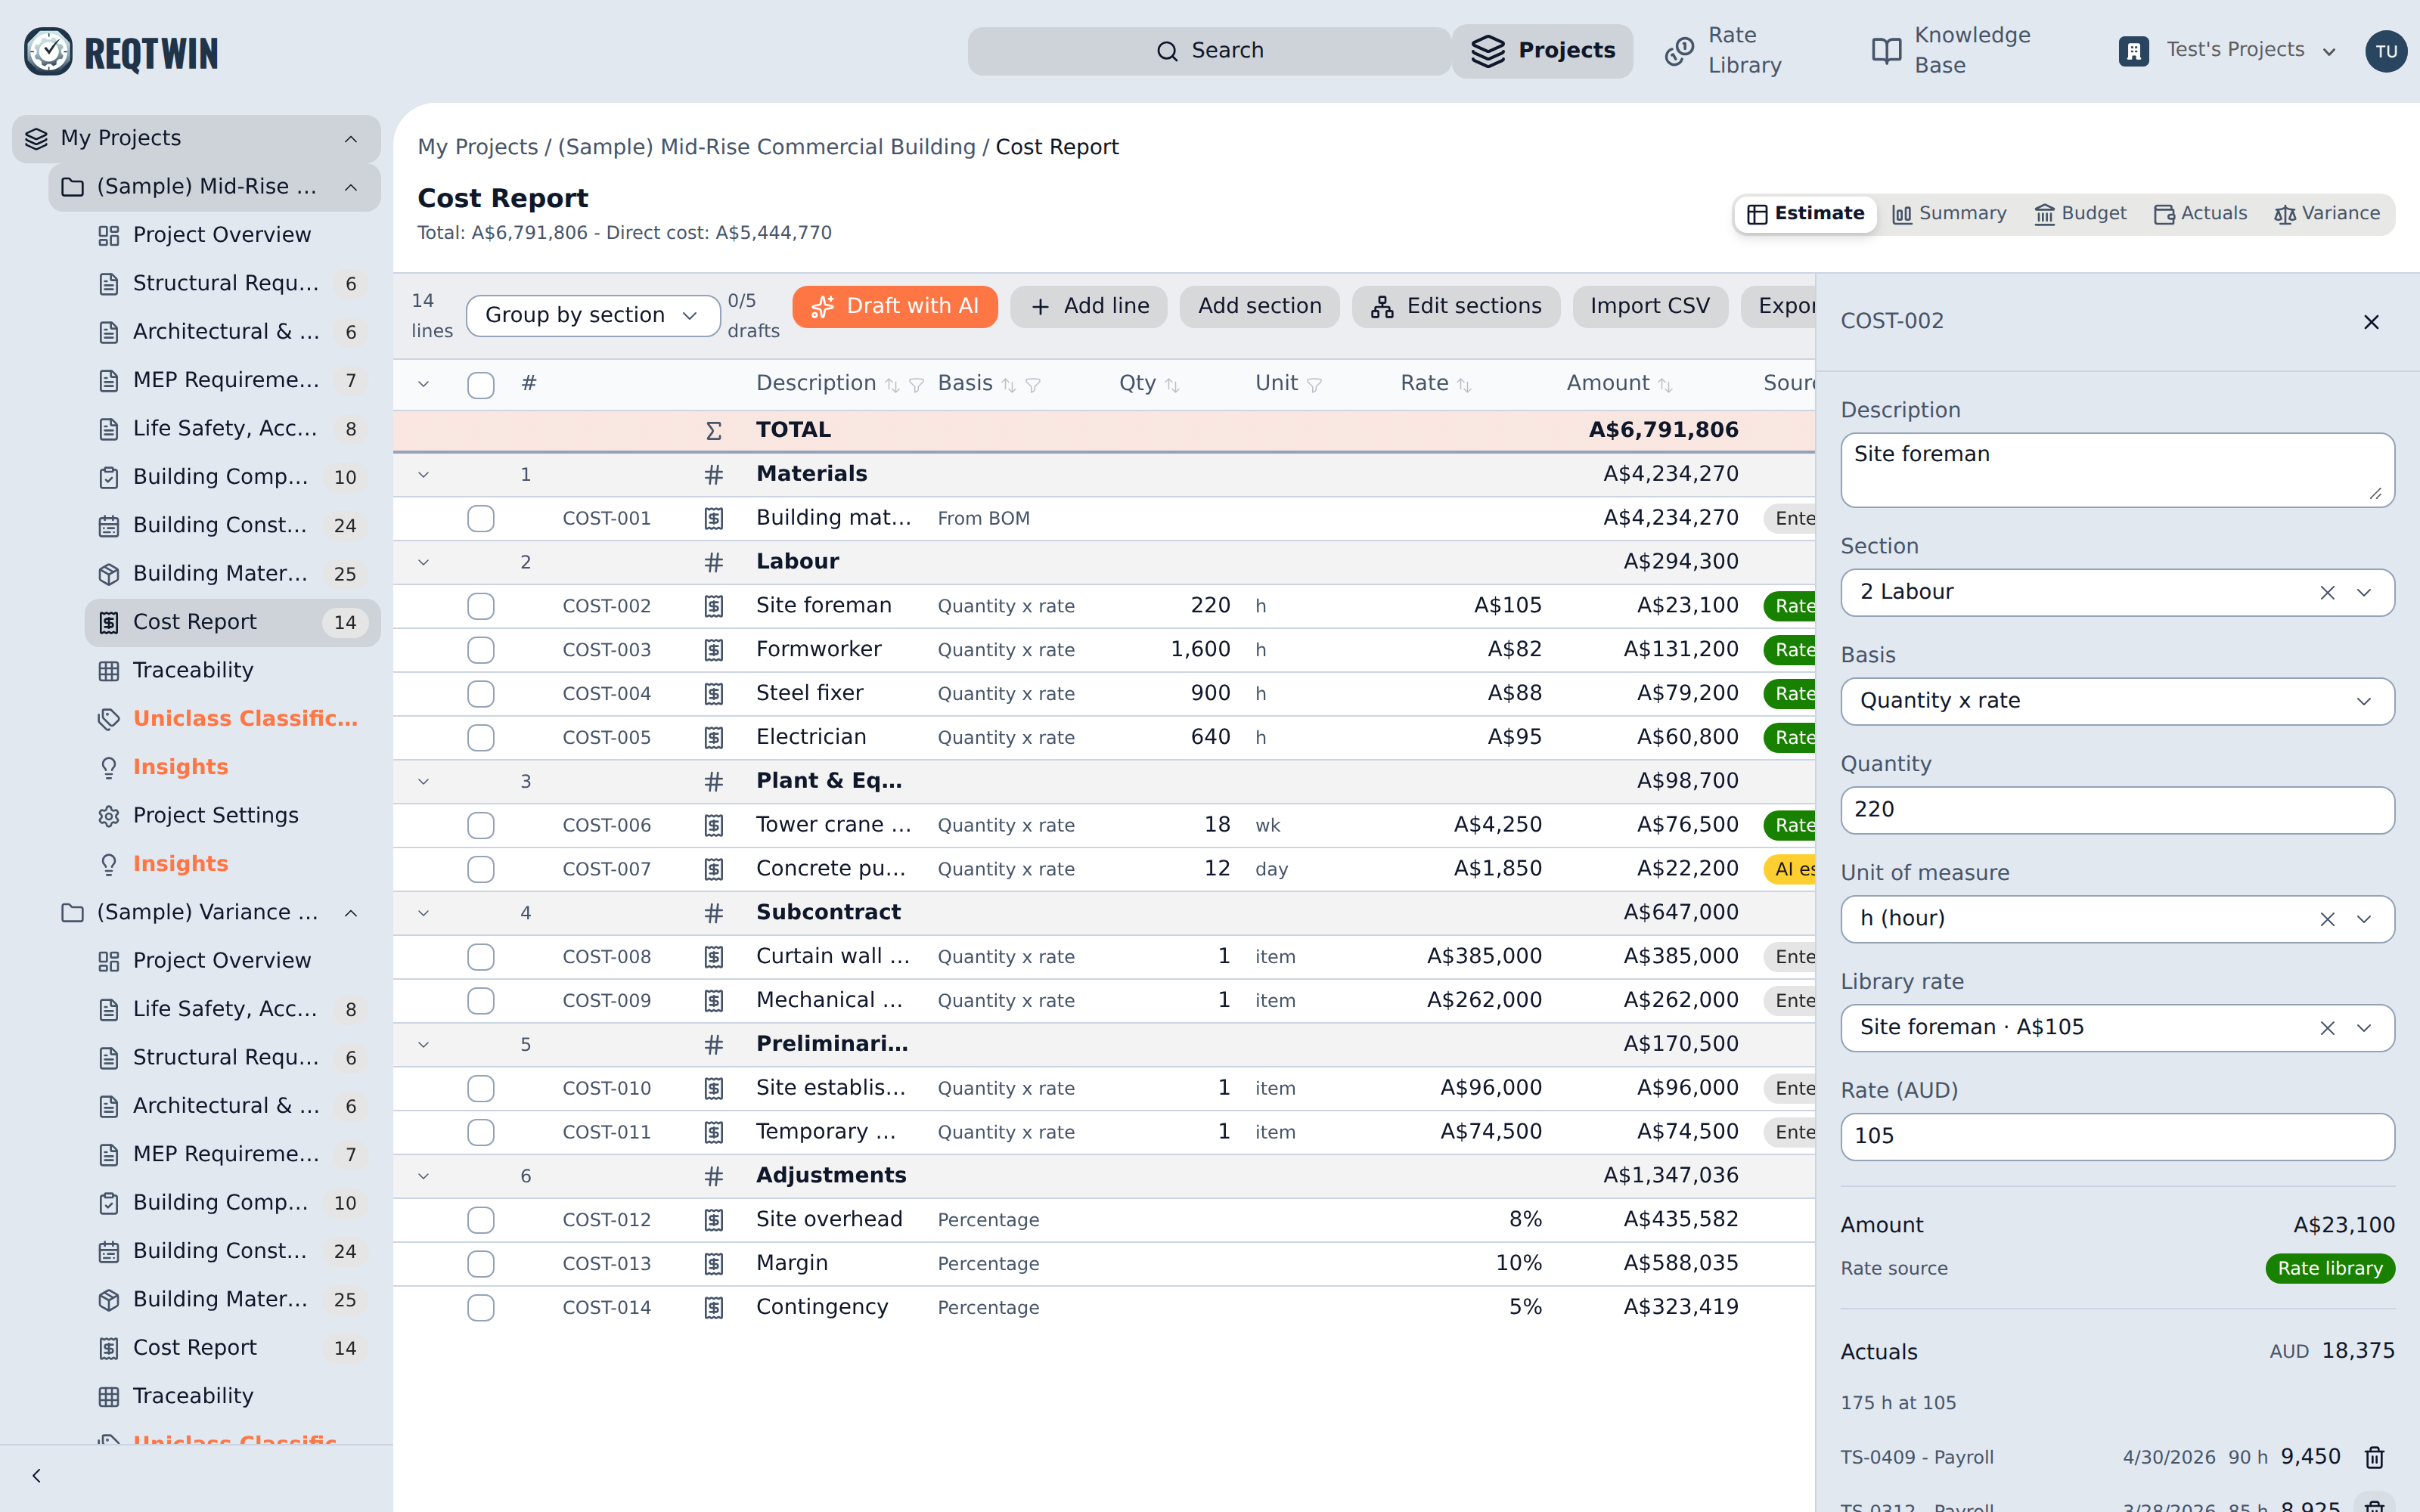
A line's detail panel: basis, quantity, unit, library rate, and the source badge under the amount.
Clicking a line opens it for editing, with its actual entries and its edit history below. A rate typed straight onto a line can be added to the rate library from here (organisation admins only), after which the line reads as priced from the library.
Grouping, sorting, filtering
Group by section is the outline as written, nested and expandable, each section carrying its subtotal. The other three groupings flatten the report to one level of subtotalled blocks: by basis, by source, or none at all. Reading by source is how you check what a rate book covered and what the AI had to guess at.
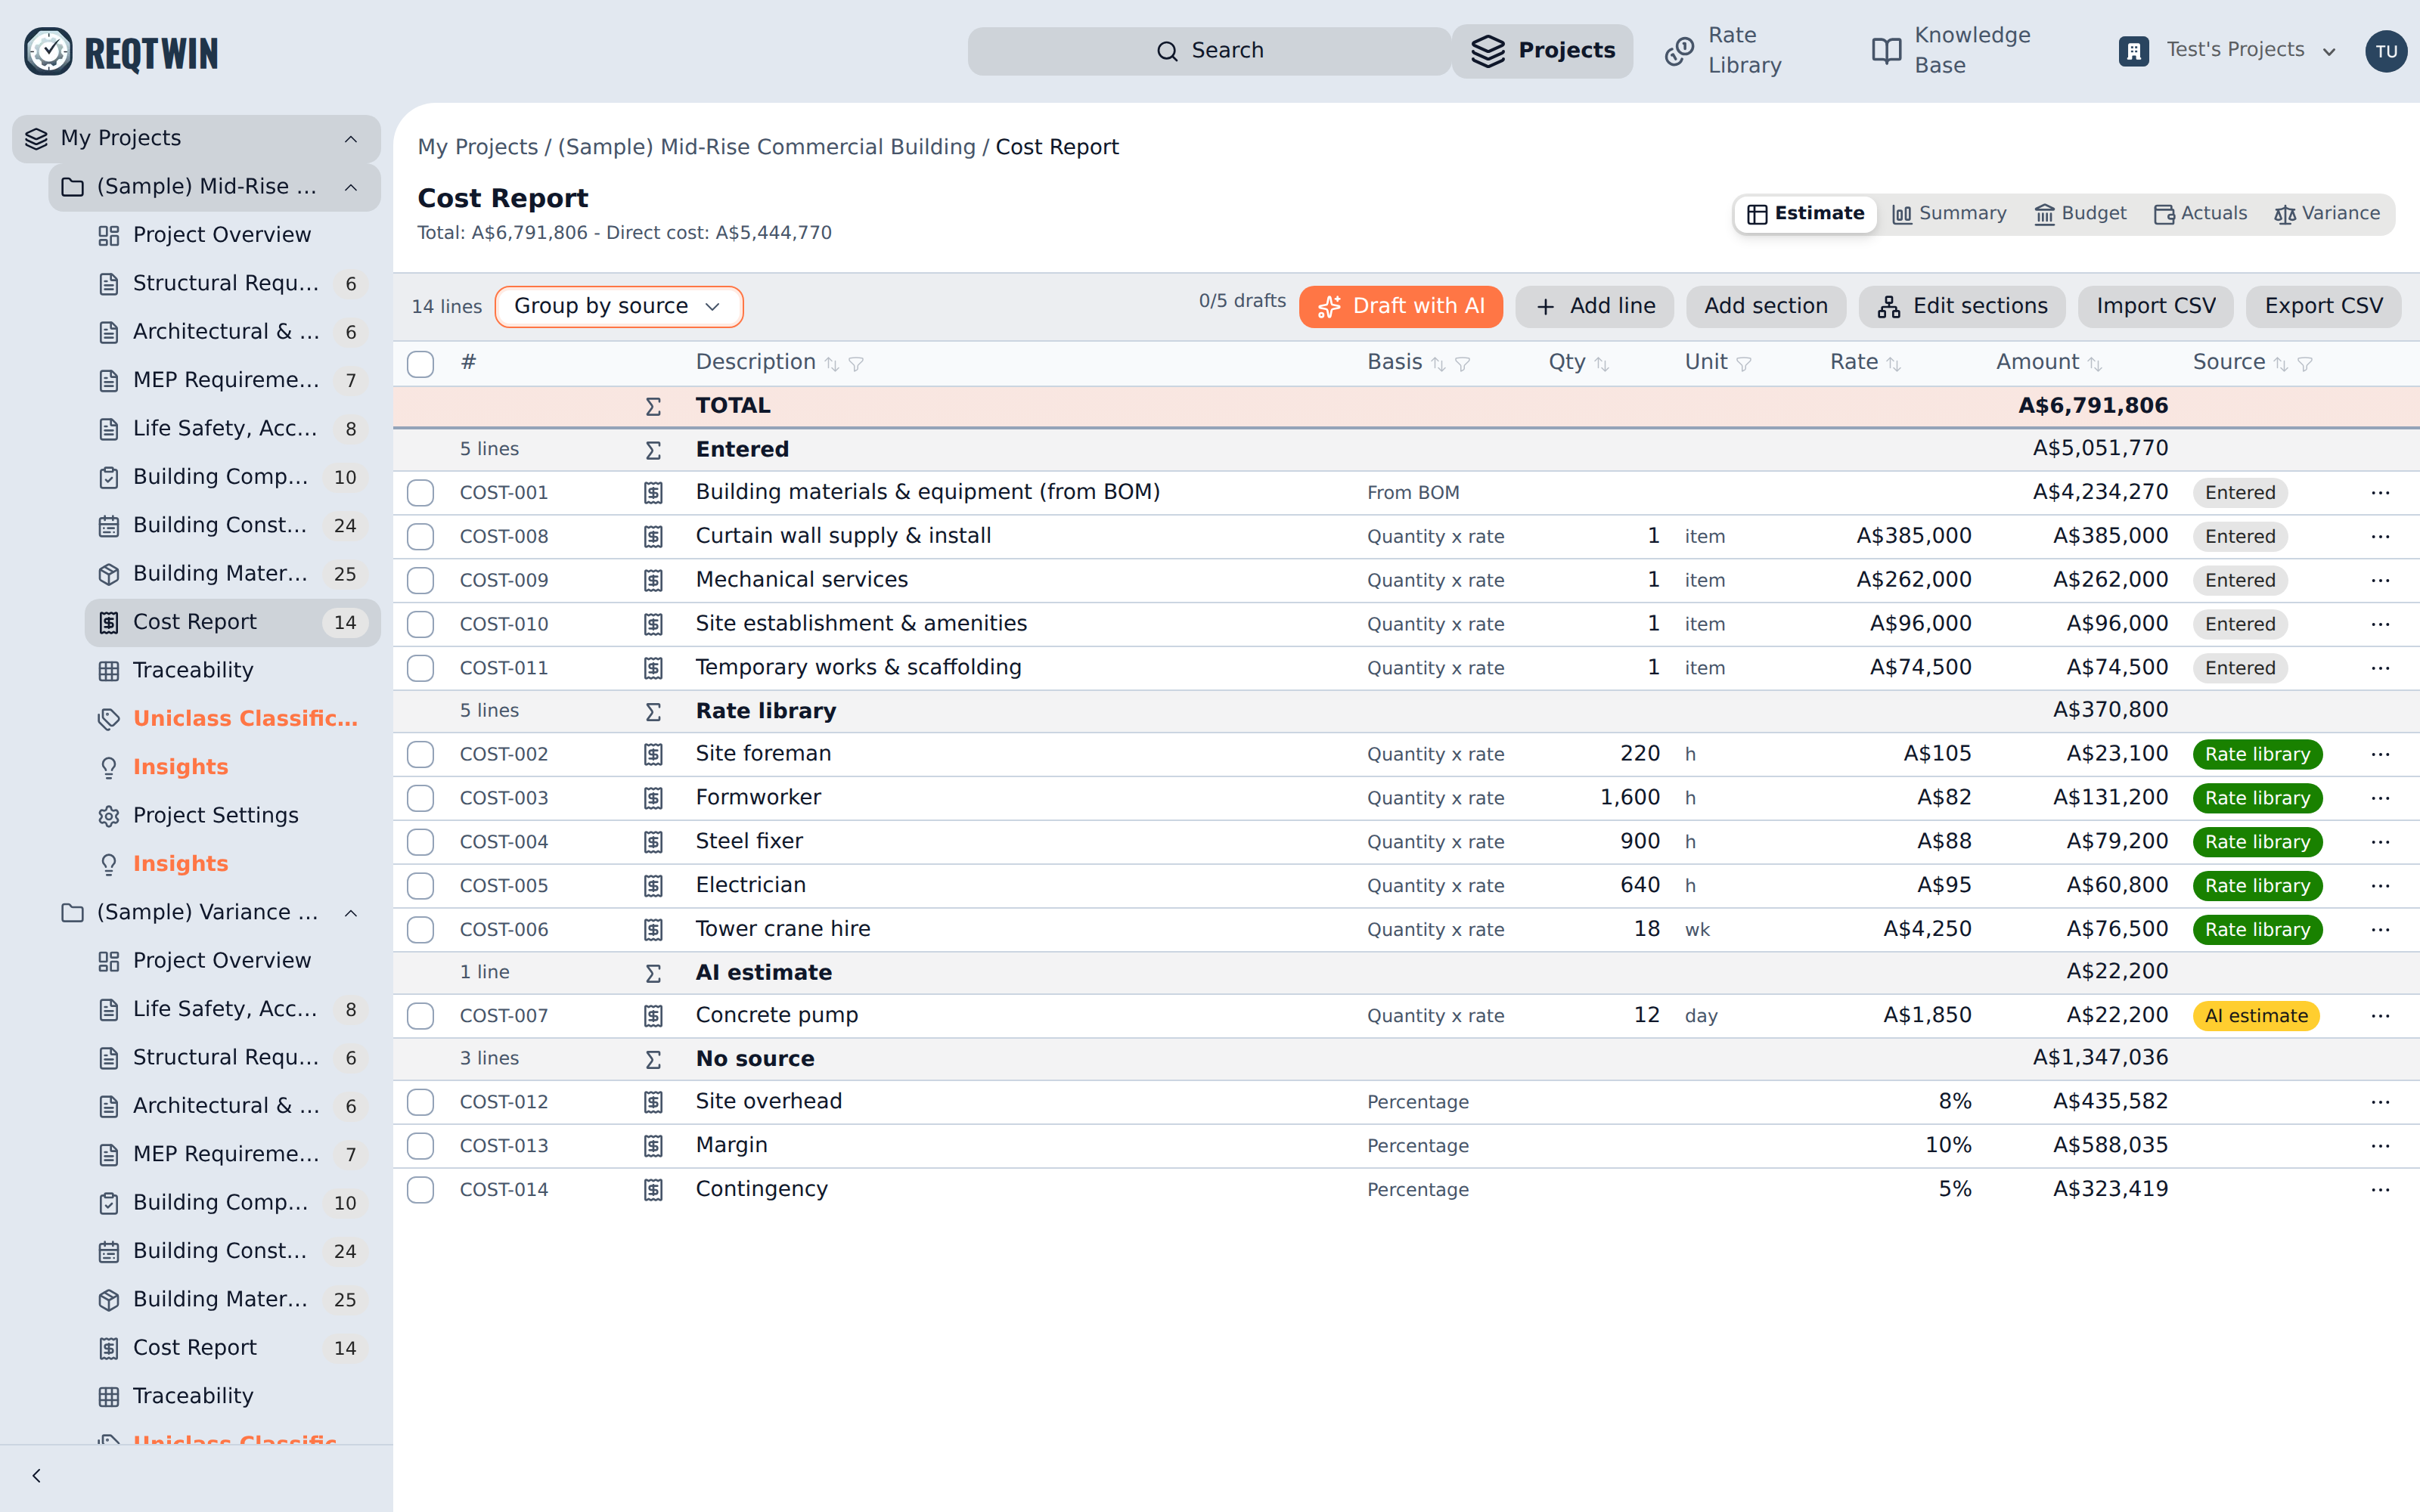
The same report grouped by source: entered, rate library, AI estimate, and the percentage lines that have no source.
Every column sorts, and Description, Basis, Unit and Source filter. The total row stays frozen at the top of the table and follows the filter, so a filtered report reads as the total of what is shown.
Drafting with AI
Draft with AI reads the project's requirements, BOM, programme, ITP and your organisation's rate library, and proposes a set of cost lines (and any new sections they need). Nothing is written when the run finishes: the review dialog lists every proposed row with its basis, rate and source, and you commit the rows you want by ticking them. Rows the model priced from the rate library take the library's authoritative number rather than the model's; rows it could not ground are flagged as its own estimate.
Drafting needs a Professional or Team plan and is capped at 5 runs per billing cycle, shown as a counter beside the button. Building and editing the report by hand works on every plan.
Importing and exporting
Import CSV walks through a column-mapping and preview step before anything is written. Export CSV produces a file in the same shape for round-tripping through a spreadsheet: id, parent_csv_id, type, outline, text, basis, quantity, unit, rate, rate_label, percent, percent_base and amount.
rate_label names the library rate a line was priced from, and is resolved back against the library on import, so a report can leave for a spreadsheet and come home still knowing where its numbers came from. An AI-estimated source does not round-trip: no external file gets to claim that provenance.