Knowledge Base
Reading the Basis Diagram
What the Basis diagram answers
One question: what is this project being built to satisfy, and how much of it hangs off each requirement?
It reads left to right. A requirement document sits at the left, its sections branch to the right, and each branch carries a count of everything that answers it. Nothing is drawn twice and nothing is silently dropped.
The tree
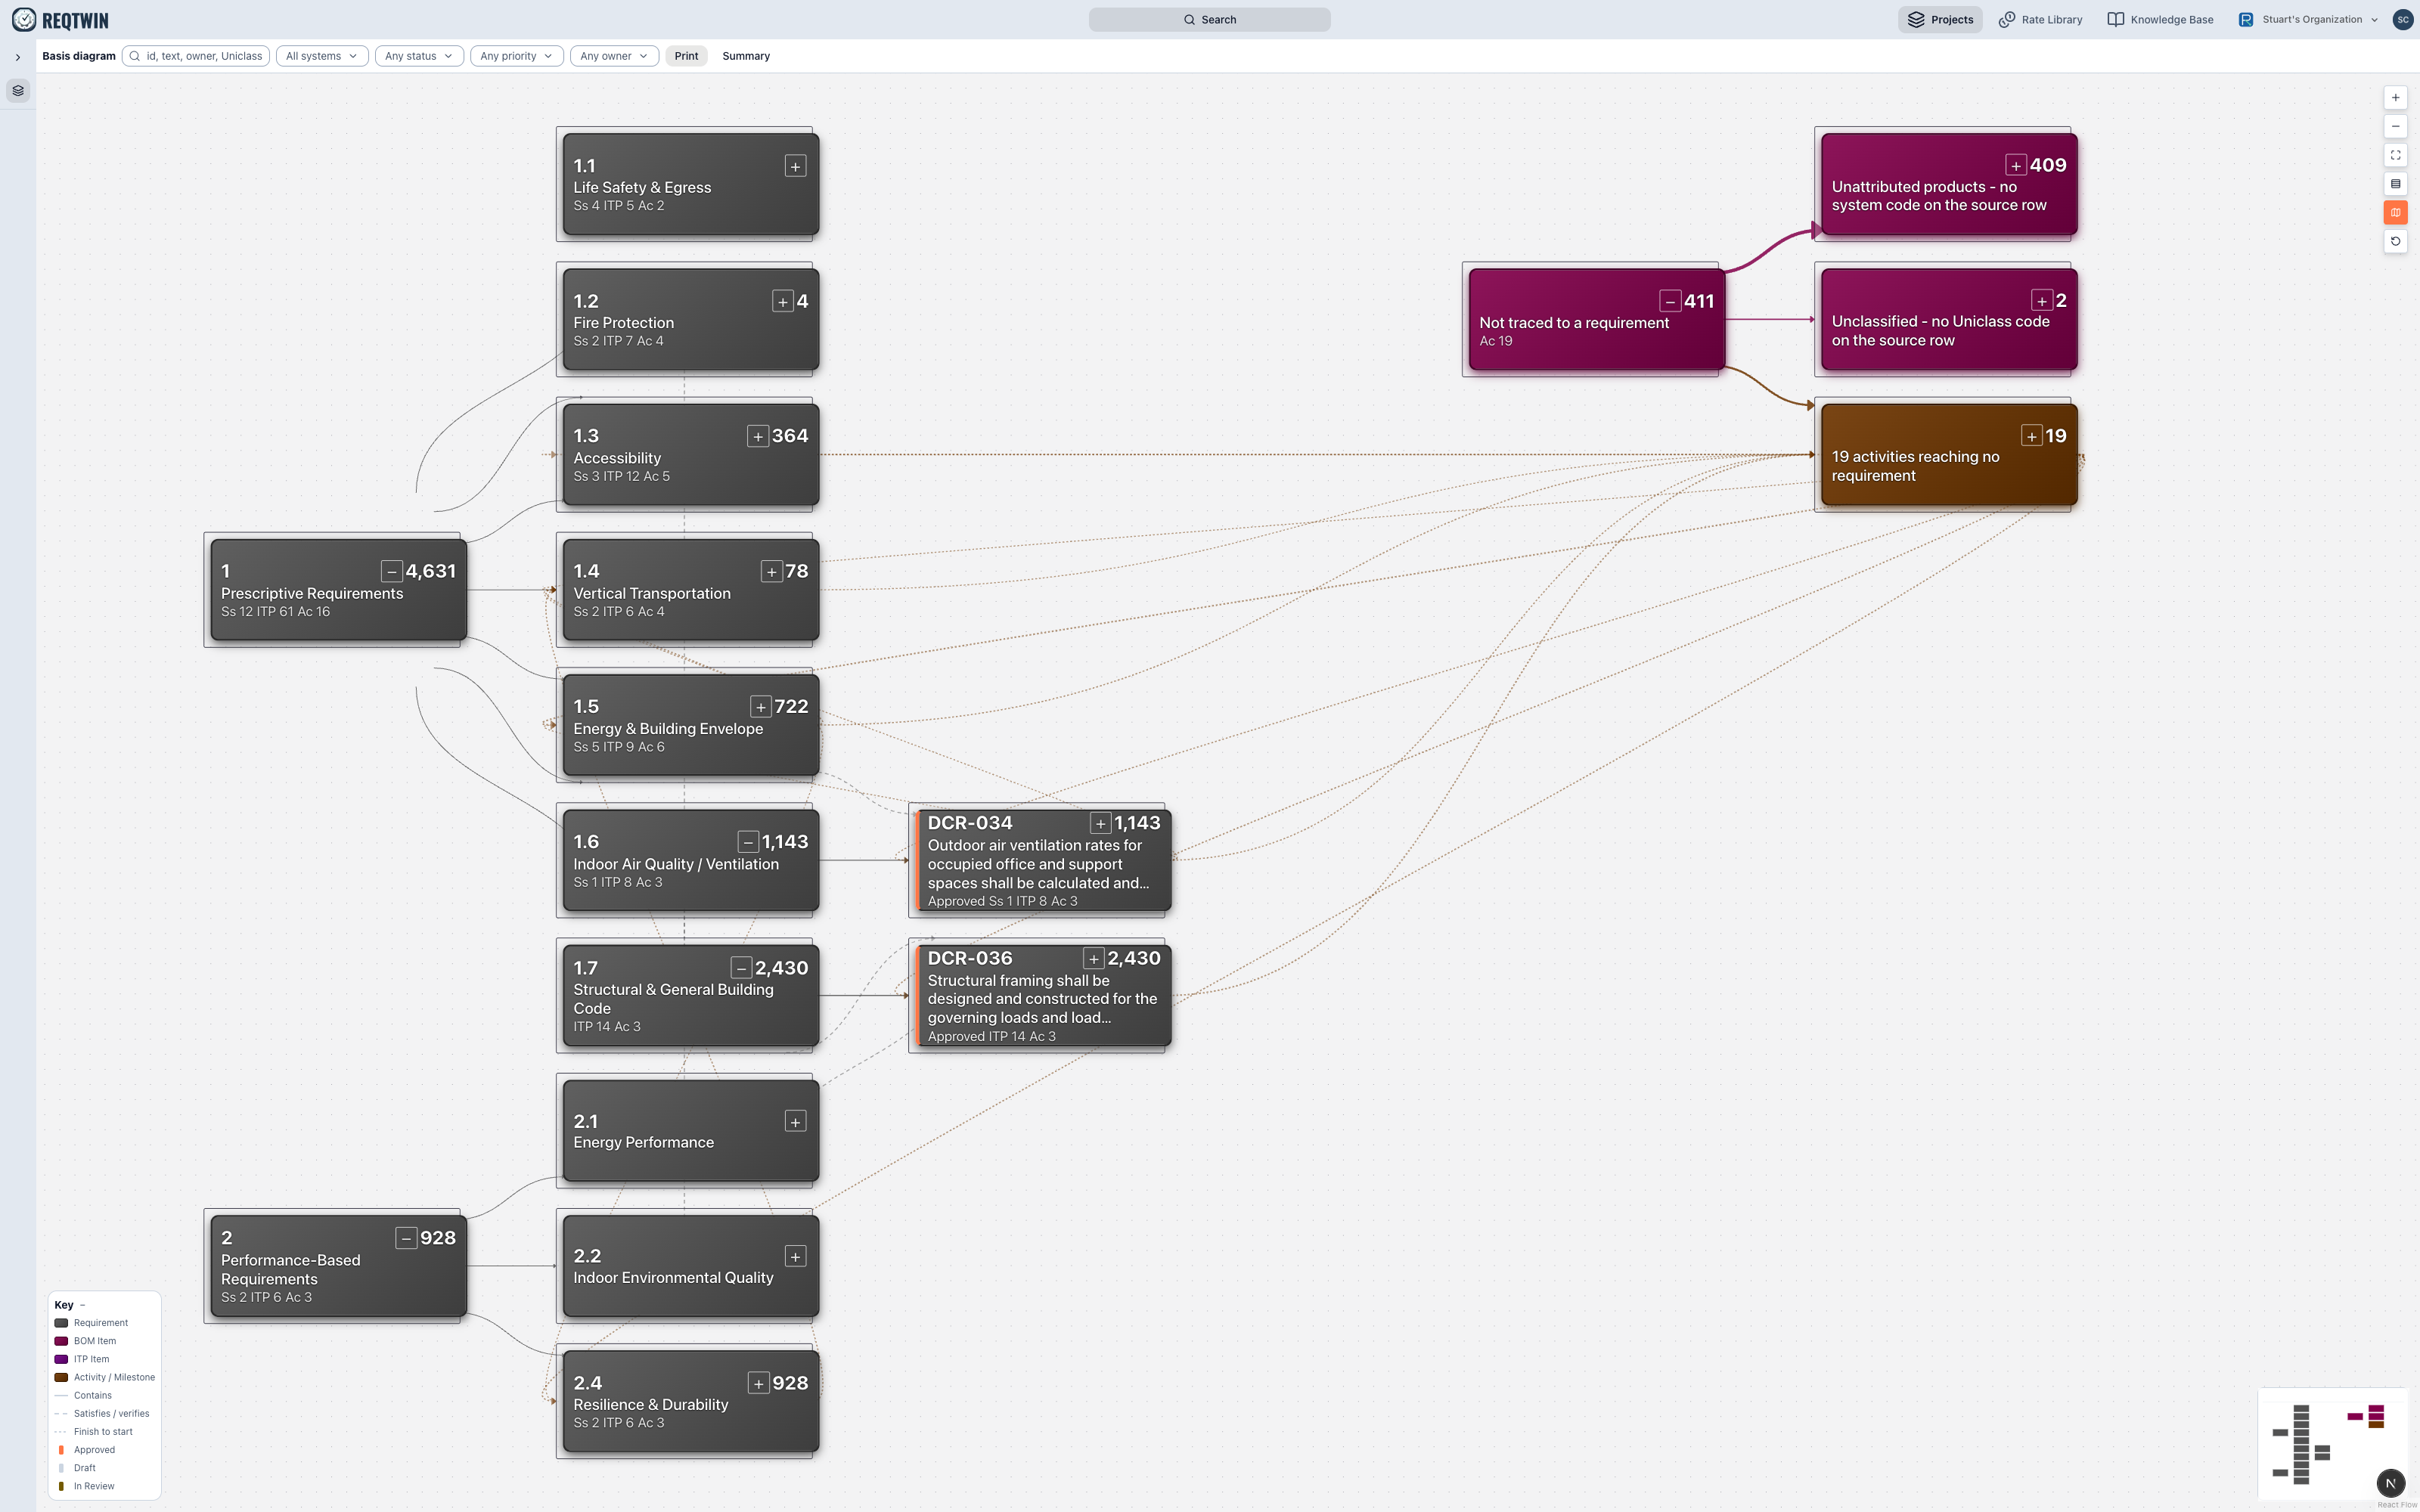
A real sheet from RQT-DCR: the requirement tree on the left with its counts and badges, and the exception cards on the right for rows that reach no requirement.
Every card carries two kinds of number.
The large number on the right of a card is the count of Pr (Uniclass products, i.e. BOM items) beneath that branch, including everything in branches still collapsed.
The badges underneath are the branch's own direct children by kind: Ss (Uniclass systems), ITP (inspection and test items), Ac (programme activities).
So a card reading Ss 3 ITP 12 Ac 5 has 3 systems, 12 ITP items and 5 activities directly under it, and its large number is every product underneath once you open everything below.
Expanding a branch
Each card that has something beneath it carries a small + at its top right; click it to open the branch, and it becomes a − while the branch is open. Sibling branches reposition rather than overlap, so the tree stays readable as it grows and the count on a parent never changes when you open it. Opening reveals where a number comes from; it never changes the number.
Collapse all returns to the top level. Reset view restores the default framing.
Filters
Four filters sit in the toolbar above the canvas, alongside the search box: System, Status, Priority and Owner.
Filtering narrows what is drawn and the counts move with it, which is the point: filter to one owner and each branch reports that owner's share. The header states the filtered totals so a reduced tree can never be mistaken for the whole project.
Discipline and location are deliberately absent. They live on the Twin side (systems.discipline, and a facility or level on an asset) with no join path to a requirement, so offering them here would mean inventing a relationship that does not exist in the data.
Reading the header honestly
The panel above the tree reports its own arithmetic rather than asking you to trust it:
MISMATCH: appears only if the tree is dropping rows and the figure names which kind and by how many.
33,464 source links rolled up: how many relationships were read to build the counts. When this is coloured, a server row cap was reached and the counts are a floor, not a total.
incl. 3,195 with no system code: products carrying no Uniclass Ss code. They are counted, not hidden; they simply cannot be filed under a system.
18,563 placements: a row satisfying more than one requirement is shown under each of them. Placements therefore exceed row count, and that is correct: the diagram shows obligations, and one product can answer several.
That last distinction matters when reconciling against a BOM export. Rows are things; placements are the times a thing is called for.
What it is not
It is not a bill of materials and not a schedule. It shows the shape of the project's obligations, so quantities and dates stay in the BOM and Programme where they are authored and where they can be edited.