Knowledge Base
The Insights Document and AI Insights Panel
The entity graph
An Insights document renders a node graph of a project's Requirements, ITP items, Programme activities, and BOM items, laid out by the relationships that already exist between them (a requirement's linked ITP item, an ITP item's milestone, a BOM part's linked requirement). Click any node to open a detail panel with a link straight through to that row's own page.
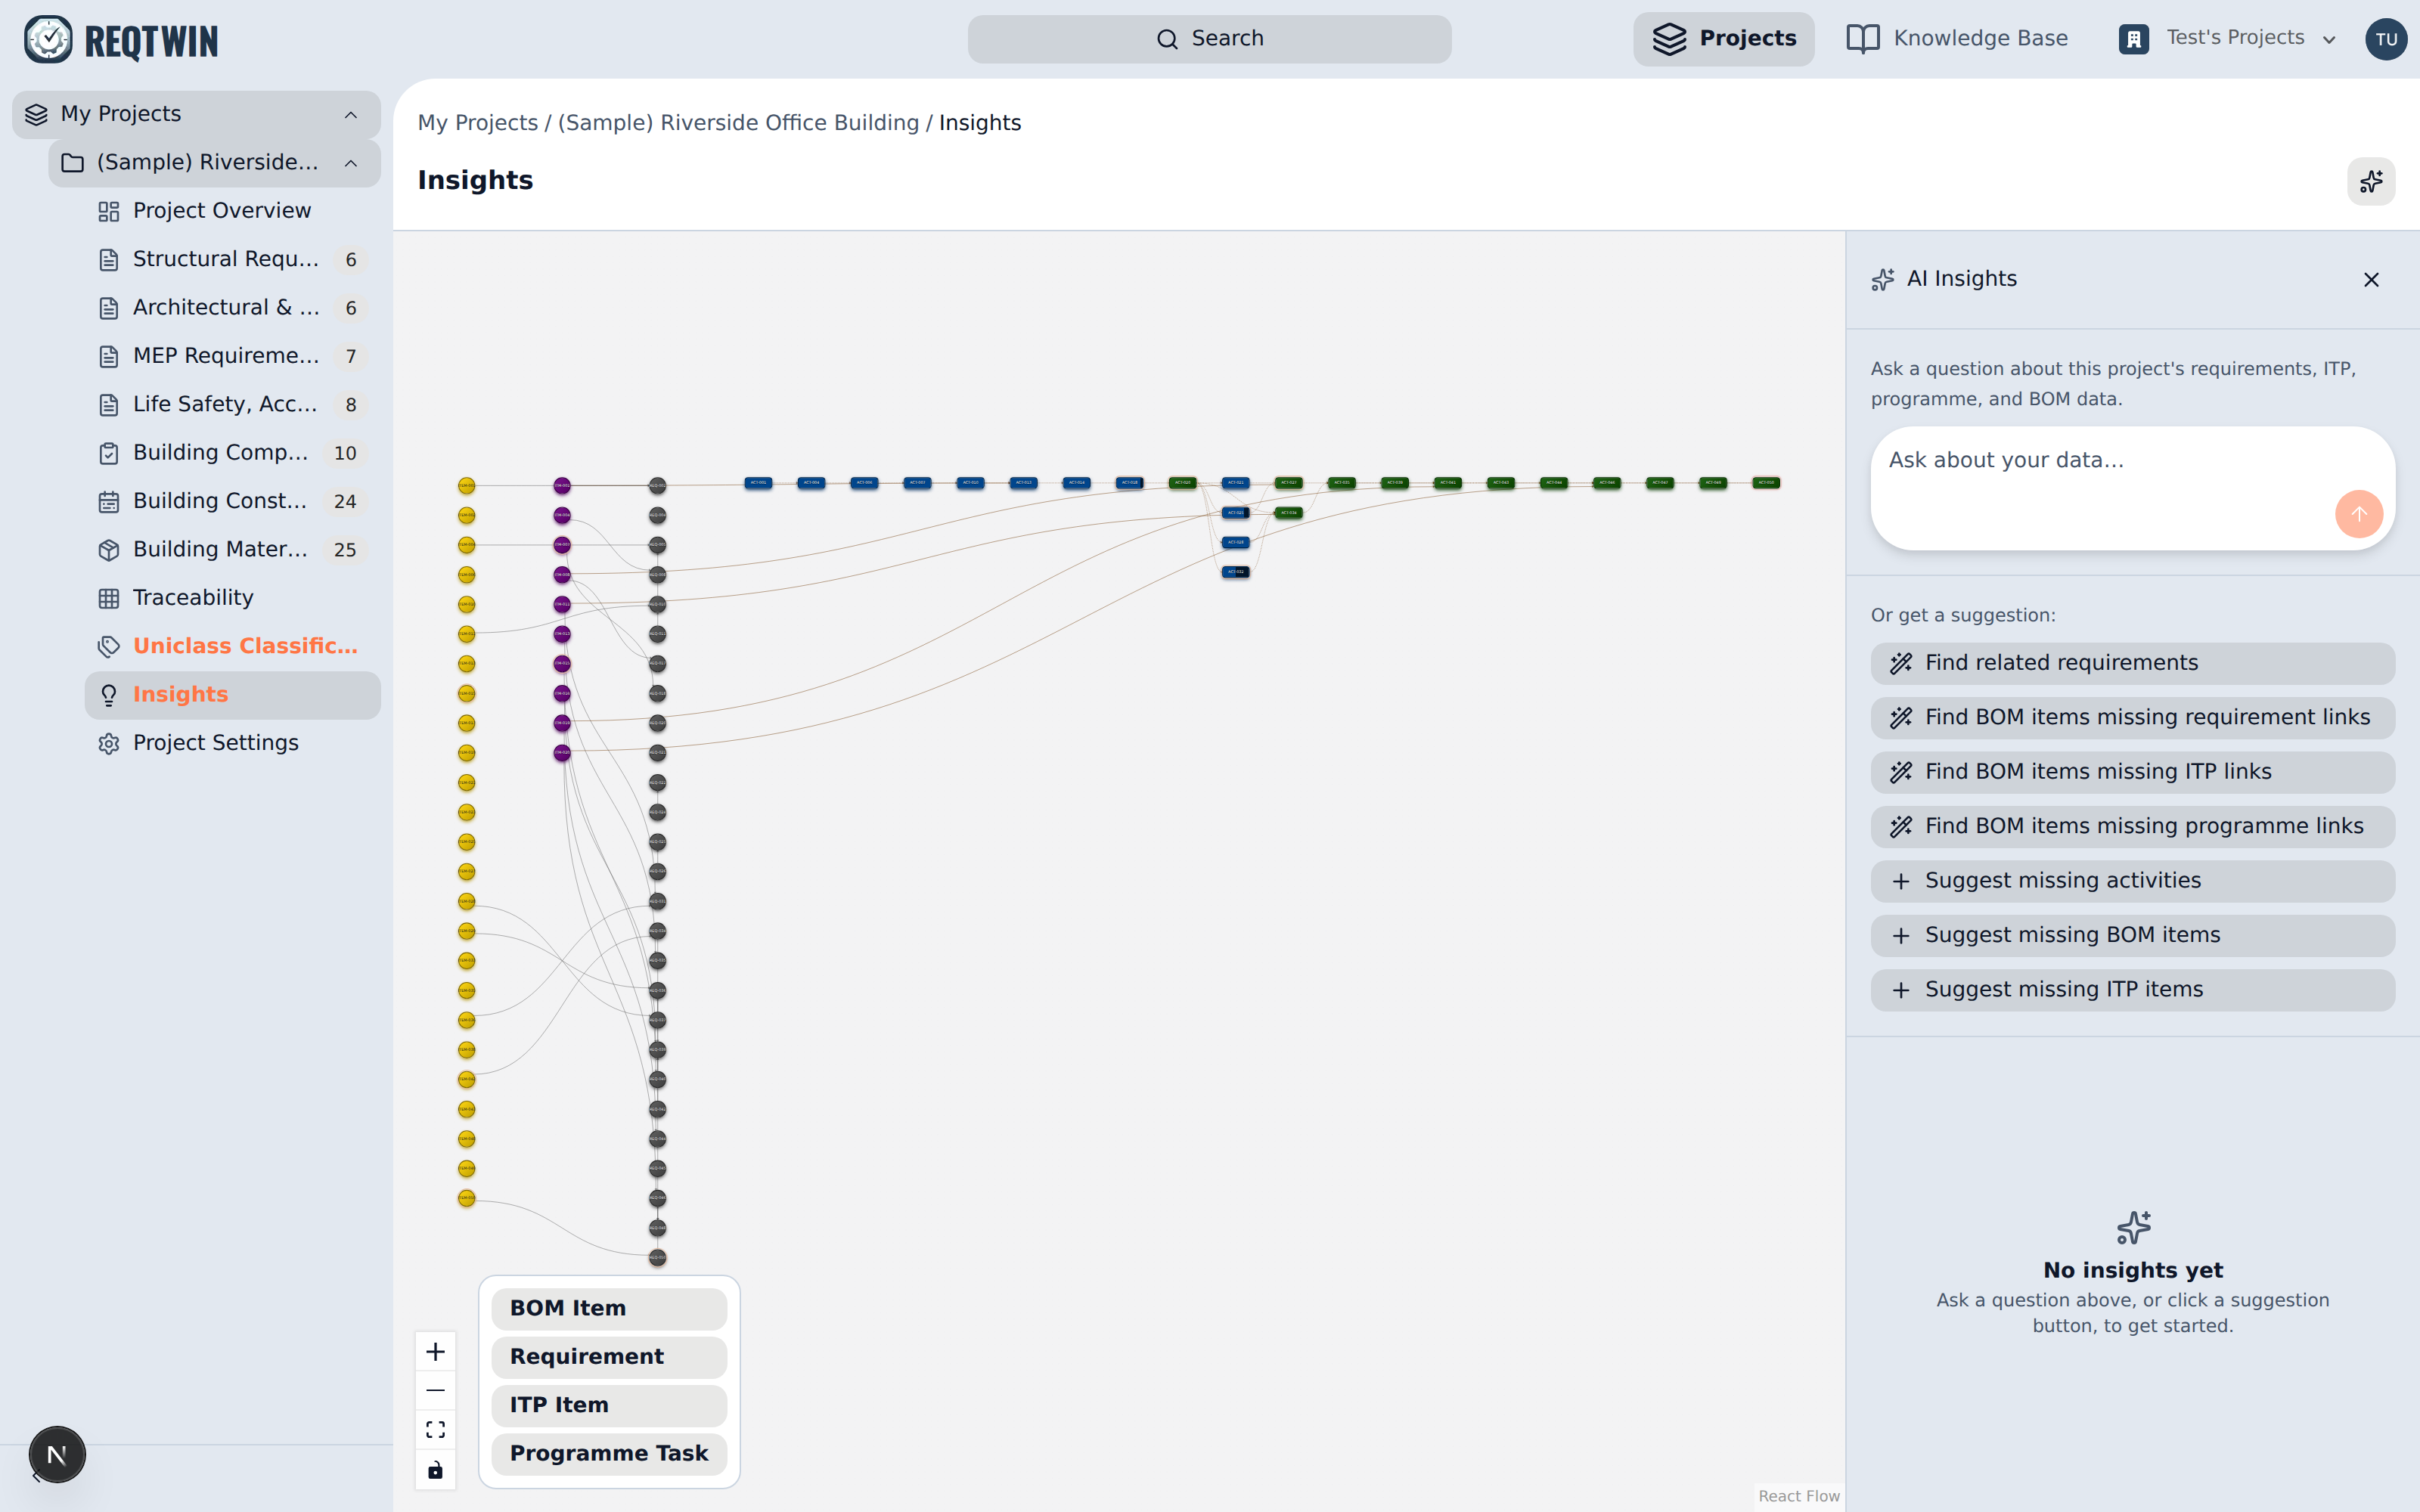
The entity graph: every requirement, ITP item, activity, and BOM item, connected by their real links.
Asking questions
The AI Insights panel alongside the graph answers free-text questions about the project (for example, "which BOM items are still backordered?") using only that project's own Requirements, ITP, Programme, and BOM text. Every answer cites the specific rows it drew from as numbered sources, each linking back to the real row, so you can verify the answer instead of taking it on faith.
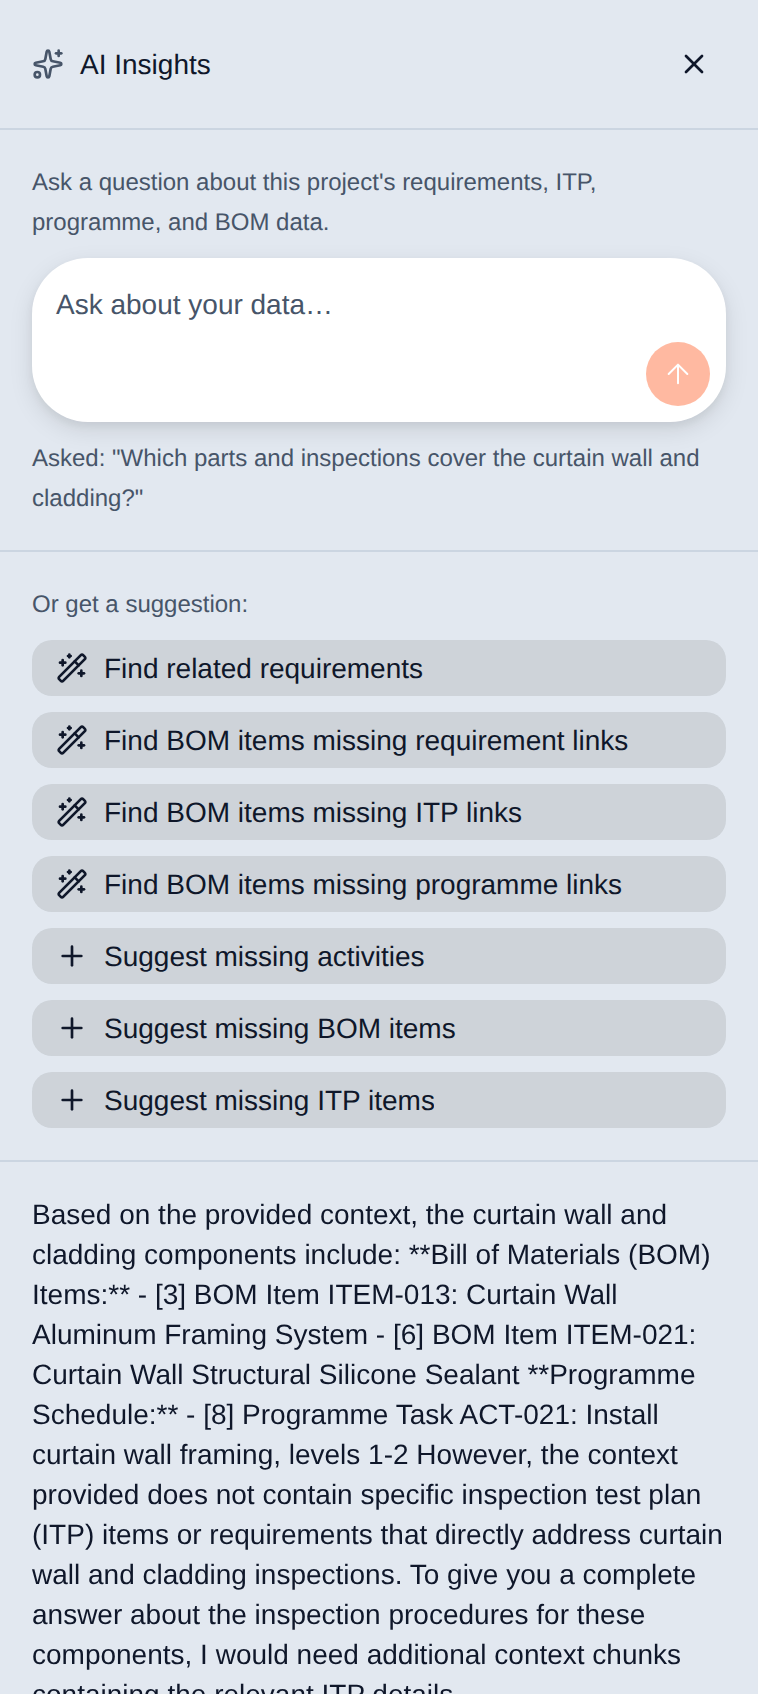
An answer in the AI Insights panel, with the project rows it drew from cited as numbered sources.
The panel also offers one-click suggestion buttons ("Find related requirements," "Find BOM items missing requirement/ITP/programme links") that surface candidate links to approve or dismiss, instead of requiring a typed question. Both the free-text answers and these suggestions are ranked so the most relevant rows surface first. See the "Finding Related Content" article for how that ranking shows up elsewhere in the app.
Availability
Insights is a paid feature, available on both the Professional and Team plans. An org without it sees the other four document types as normal but won't have Insights documents to open.