Knowledge Base
Reading the Programme Gantt
Switching to the Gantt
The View control offers Gantt as a third mode alongside Table and Kanban. It is on the Programme register only, since it is the only register whose rows carry dates to plot.
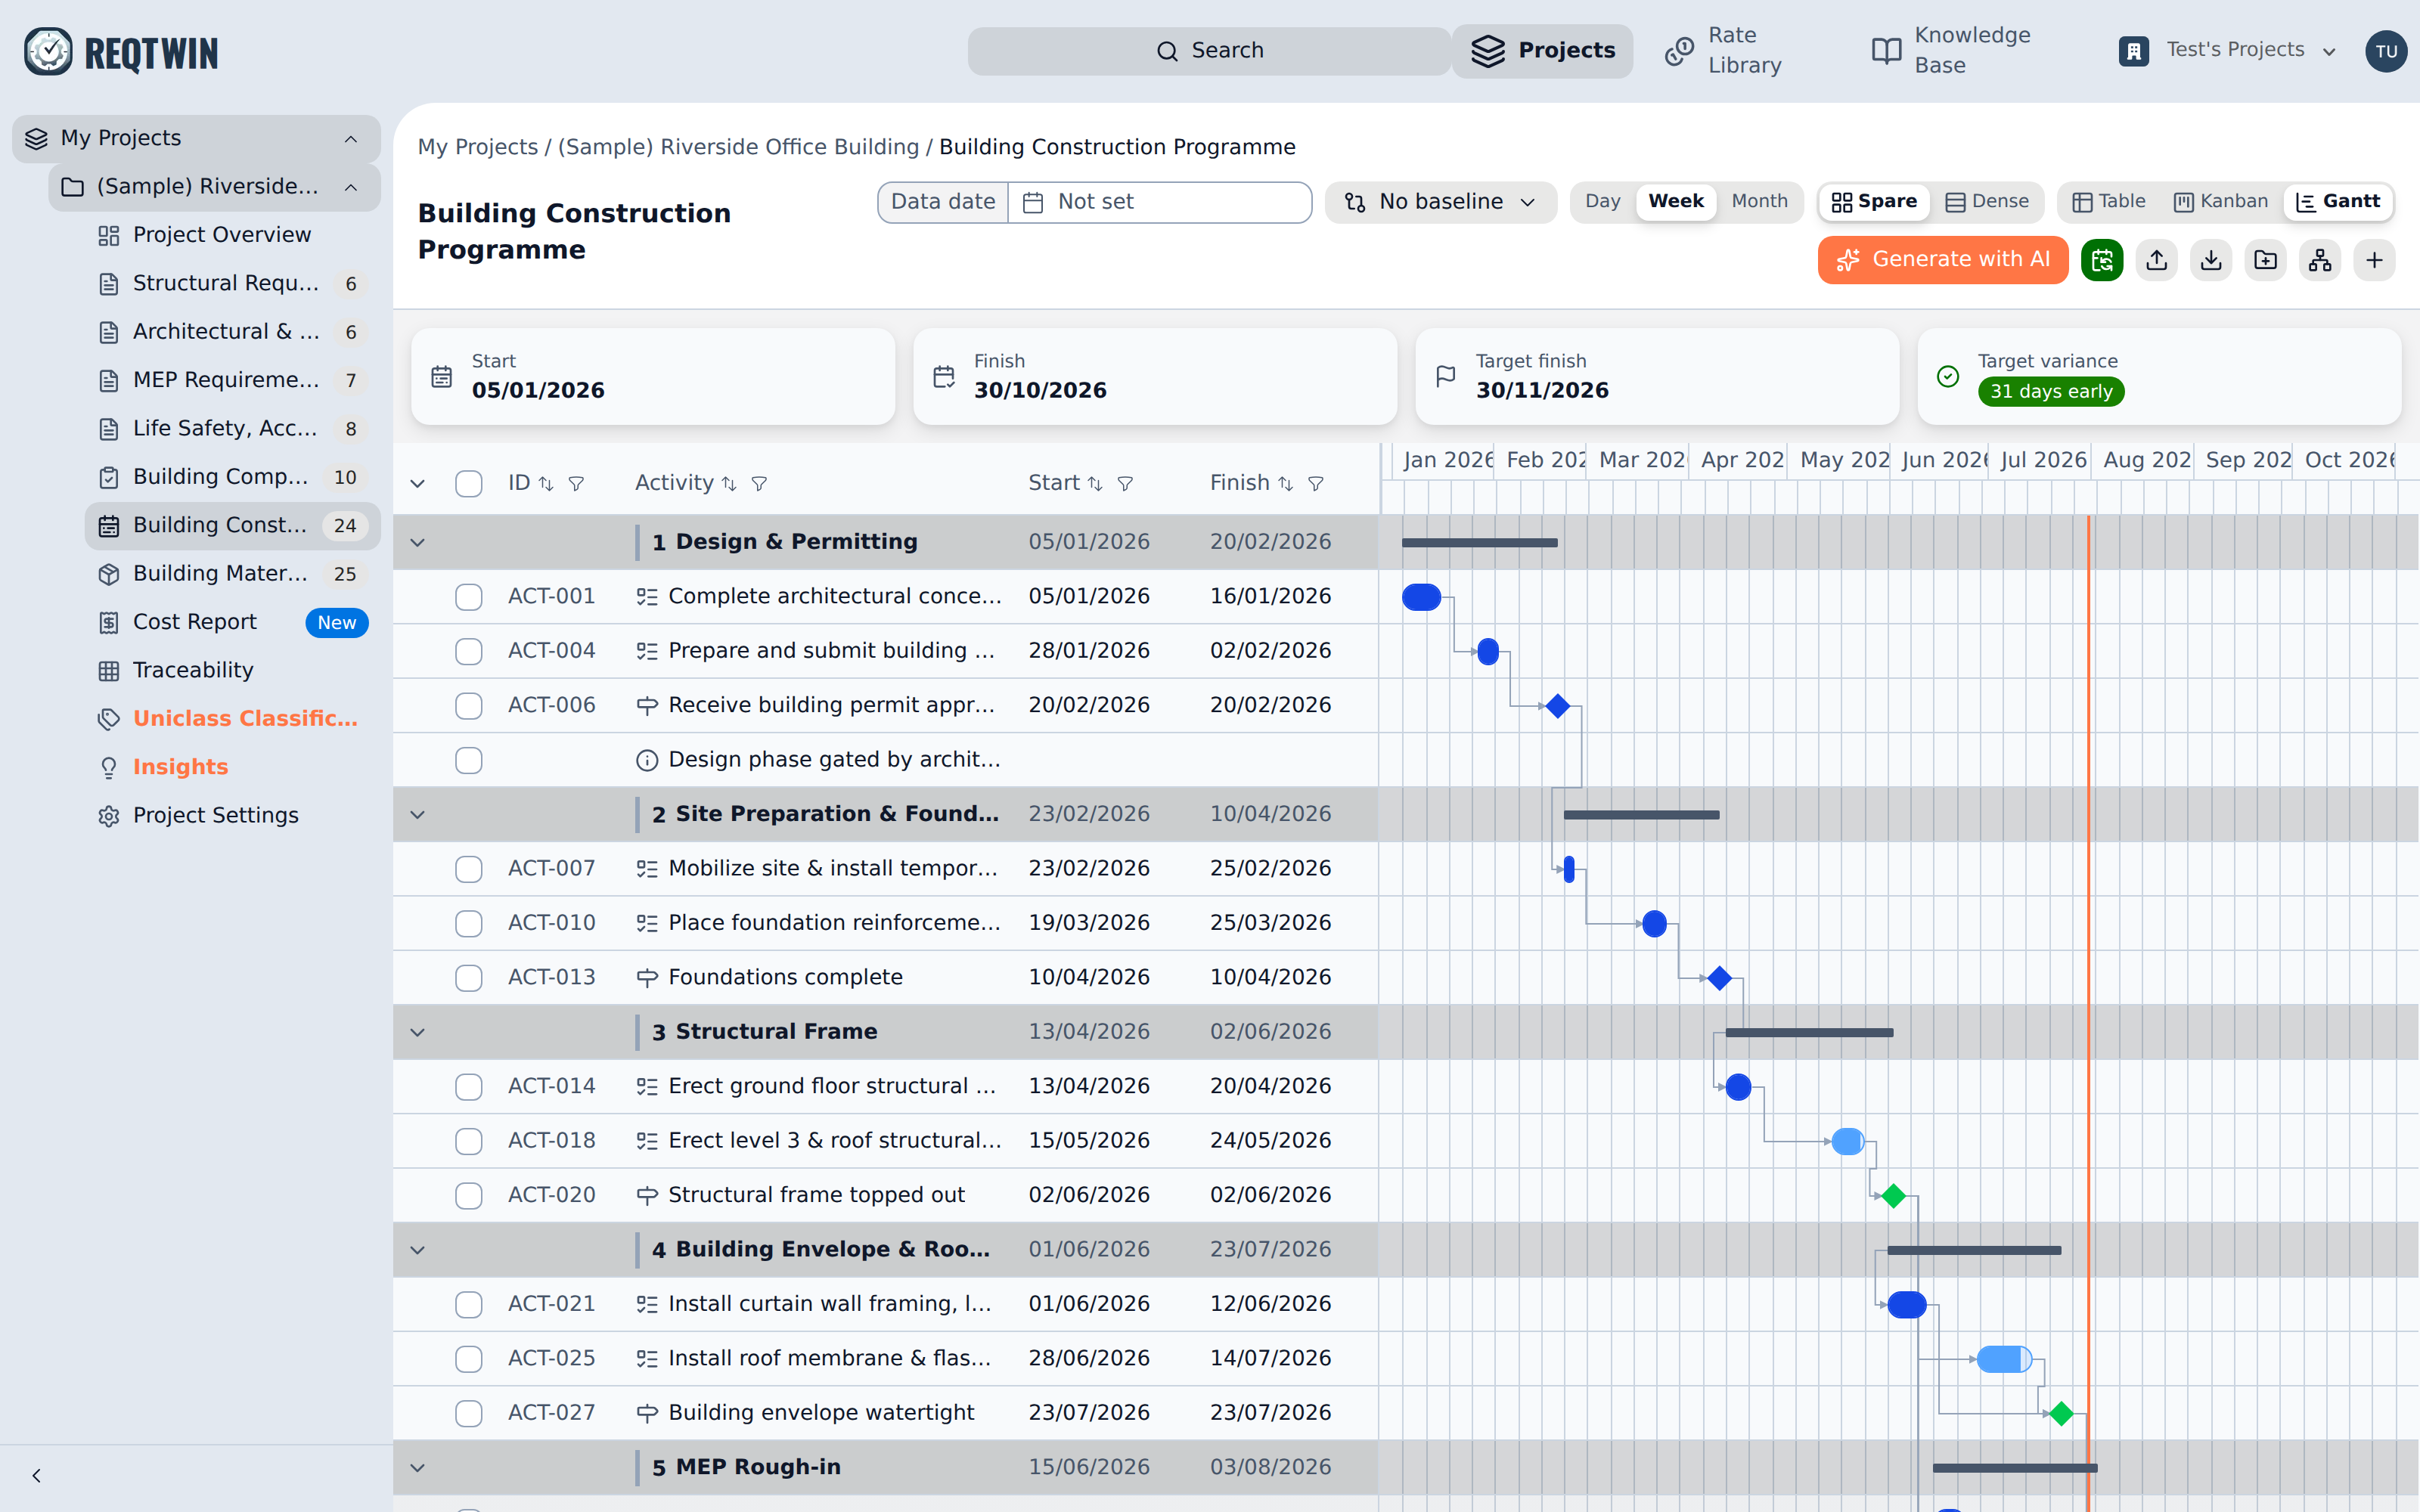
The Programme register in Gantt view: the outline on the left, one bar per dated activity against a calendar.
The Gantt draws the document's own outline: WBS elements and the activities under them, every row on one page. Nothing here groups or pages, which is why the Group by selector is replaced by a Timescale control while the Gantt is showing (see "Timescale, Density, and Folding on the Gantt"). Sorting and filtering are done from the Gantt's own column headers instead, and stay with the chart rather than following the Table.
Your Table/Kanban/Gantt choice is remembered per register, so a programme left in Gantt view opens in it next time.
What each row draws
The frozen left pane carries a fold chevron, a selection checkbox, the row's ID, its name, and its start and finish dates, so the dates are readable without hovering a bar or opening the panel. A WBS element's ID is its outline number and its dates are the span of everything beneath it, greyed to mark them as rolled up rather than stored.
An activity with a start date draws a bar from its start to its end.
A milestone draws a diamond on its single date, sitting on the close of that day so it lands flush against the finish of whatever it waits on.
A WBS element draws a thin summary bar spanning every dated activity beneath it, at any depth.
An activity with no start date, and an information row, draw nothing. The row itself still lists.
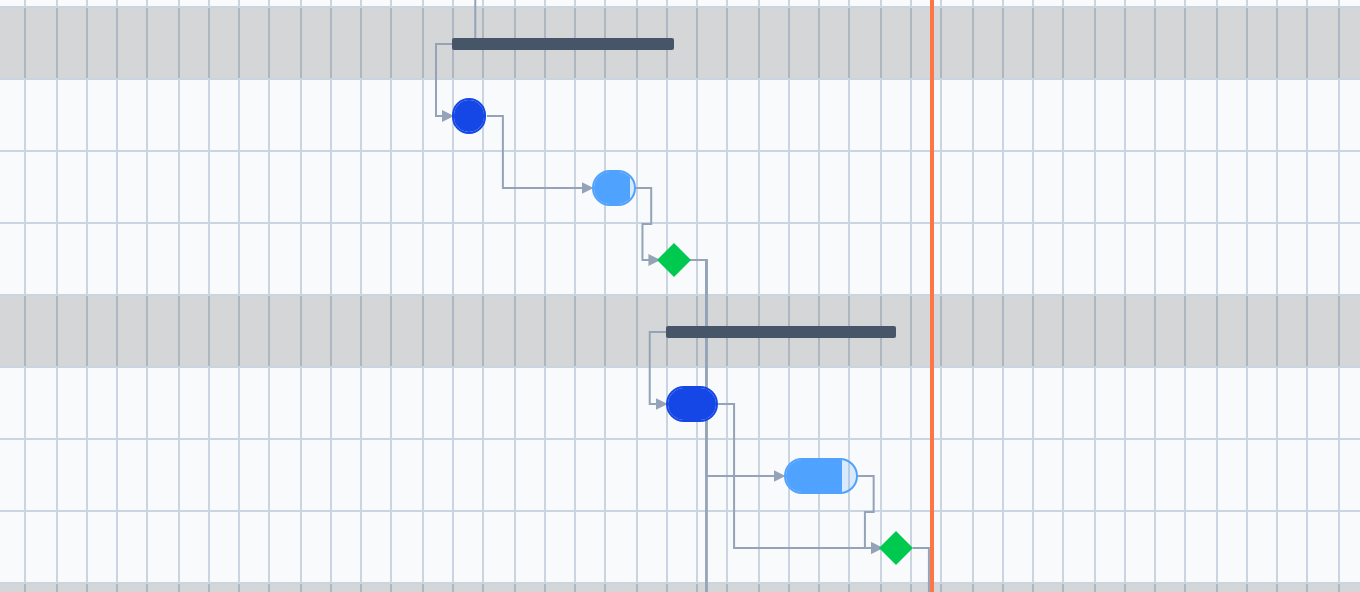
The chart on its own: summary bars, activity bars, milestone diamonds, dependency arrows, and today's marker.
Sorting and filtering the columns
Each of the four columns carries two controls in its header: press the column name to sort by it, or the funnel beside it to filter on it.
Sorting cycles ascending, descending, then back to outline order, and applies at every level: WBS elements reorder against each other and activities reorder inside the element they sit under. A WBS element sorts on the same rolled-up dates it displays, so sorting by Start puts the phases in the order they begin. Rows with nothing in that column, an activity with no dates under a date sort, fall to the bottom either way.
Filtering keeps ID and Activity as "contains" matches, Start as "on or after", and Finish as "on or before". Filters combine, and a WBS element survives when anything beneath it matches, so a filtered chart keeps its structure instead of flattening to a list. The timeline rescales to whatever is left, and folded sections open while a filter is on so no match stays hidden inside one.
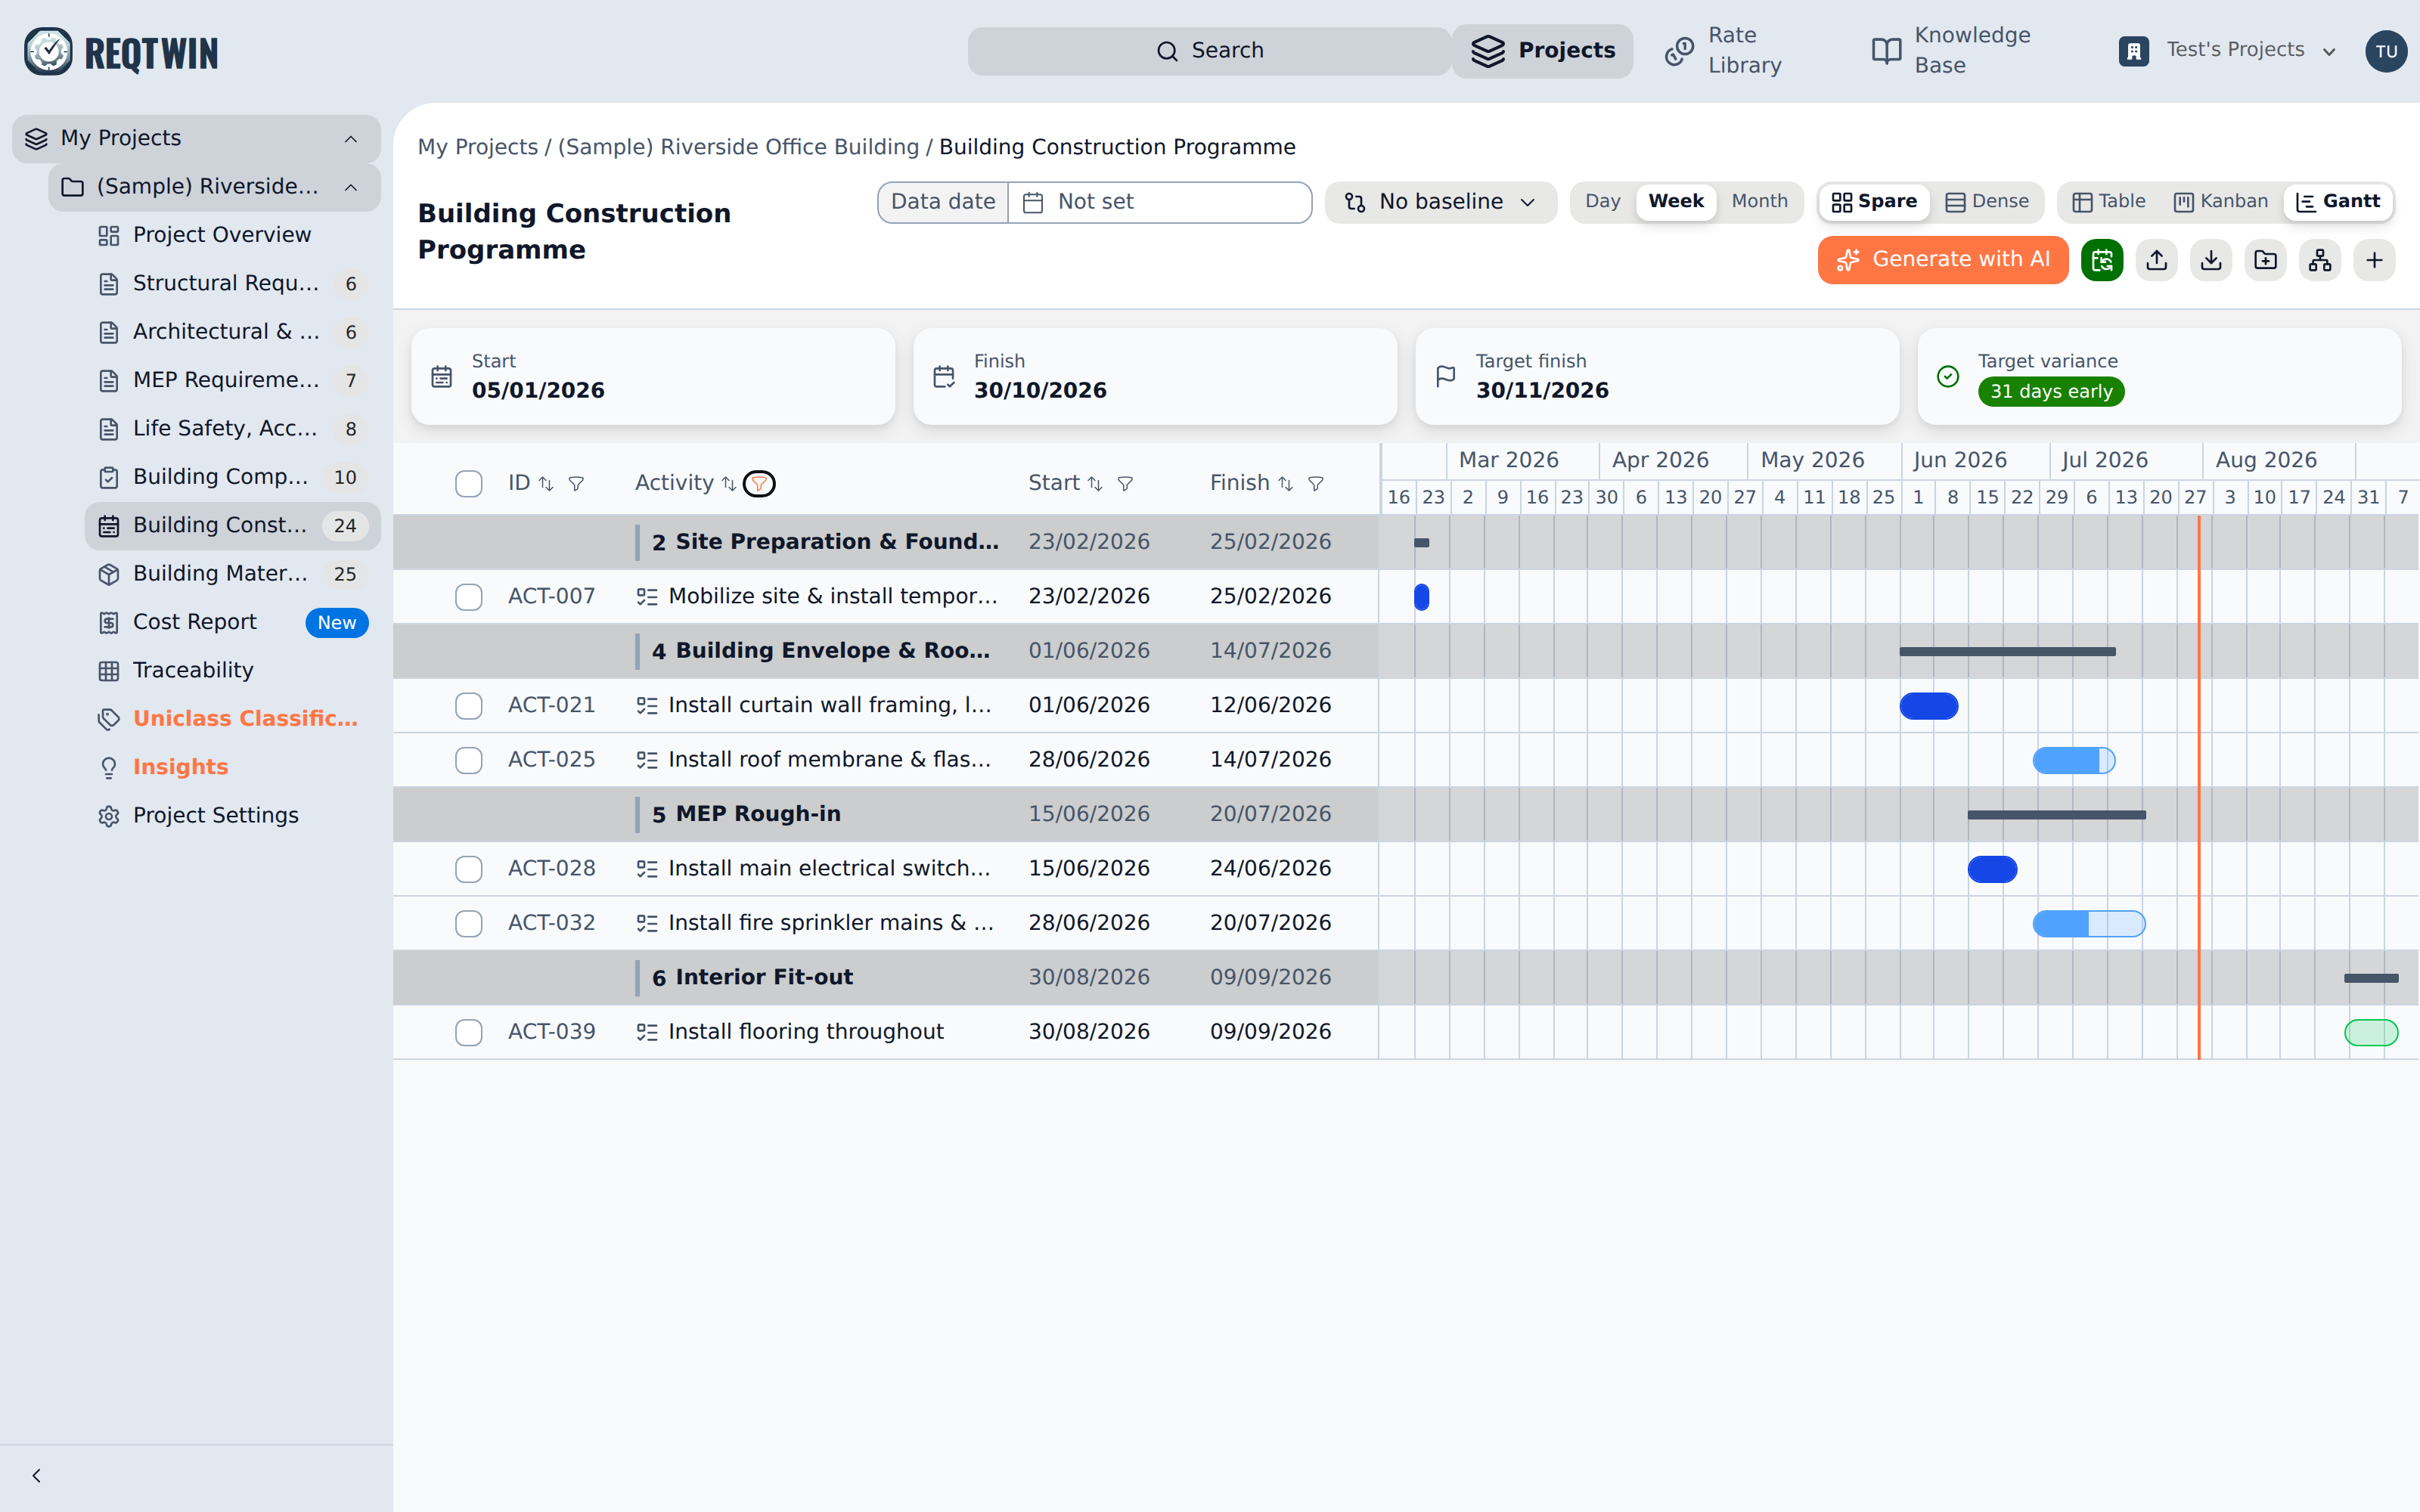
The Activity column filtered to "install", with the matching activities left under their WBS elements.
An accented funnel marks a column that is filtering. Sort and filter are view state of the chart alone: they never change the stored programme, and they leave the Table's own sort and filters untouched. They survive a switch to Table and back for as long as the register stays open, and reset when it is reopened.
Selecting rows
The checkbox at the head of each row selects it for bulk actions, and the one in the column header selects every row on screen. WBS elements have no checkbox: deleting one is done from Edit WBS, not from a selection. Ticking a checkbox does not open the detail panel or fold a section.
Selected rows raise the same toolbar the Table view uses, showing the count with Delete N and Deselect all. Deleting an activity that has children removes them with it. The selection is shared with the Table, so rows picked on the Gantt are still selected after switching views.
Colour and fill
Bar colour is the activity's Status: green for not started, blue for in progress and for complete, grey where no status is set.
Fill is the progress. A blue bar is shaded to its % Complete while in progress and solid once complete, so how much of a bar is coloured in reads as how far along it is. A not started bar is an outline, since there is no progress to show yet.
An activity that is past its end date without being complete overrides all of that and draws red, since late is the one thing a bar has to say louder than how far along it is.
With a baseline in view a second, thinner bar sits under each live one, marking where that activity was frozen (see "Baselines and Schedule Variance").
Dependencies and today
Every predecessor an activity names draws as an elbowed arrow from that predecessor's finish to this activity's start. A chain reads left to right down the page; an arrow that doubles back on itself is a successor starting before its predecessor finishes, which is the thing Schedule exists to resolve (see "Scheduling Work in the Programme Register").
An accent line marks today. The timeline always contains today, even on a programme that finished months ago, so the marker is never off the end of the chart.
Hovering a bar or a diamond shows its name and its dates.
The Gantt reads, the panel writes
Clicking a bar or its row selects that activity and opens the same detail panel the Table uses, which is where the editing happens: dates, duration, % complete, status, owner, the milestone toggle, and dependencies.
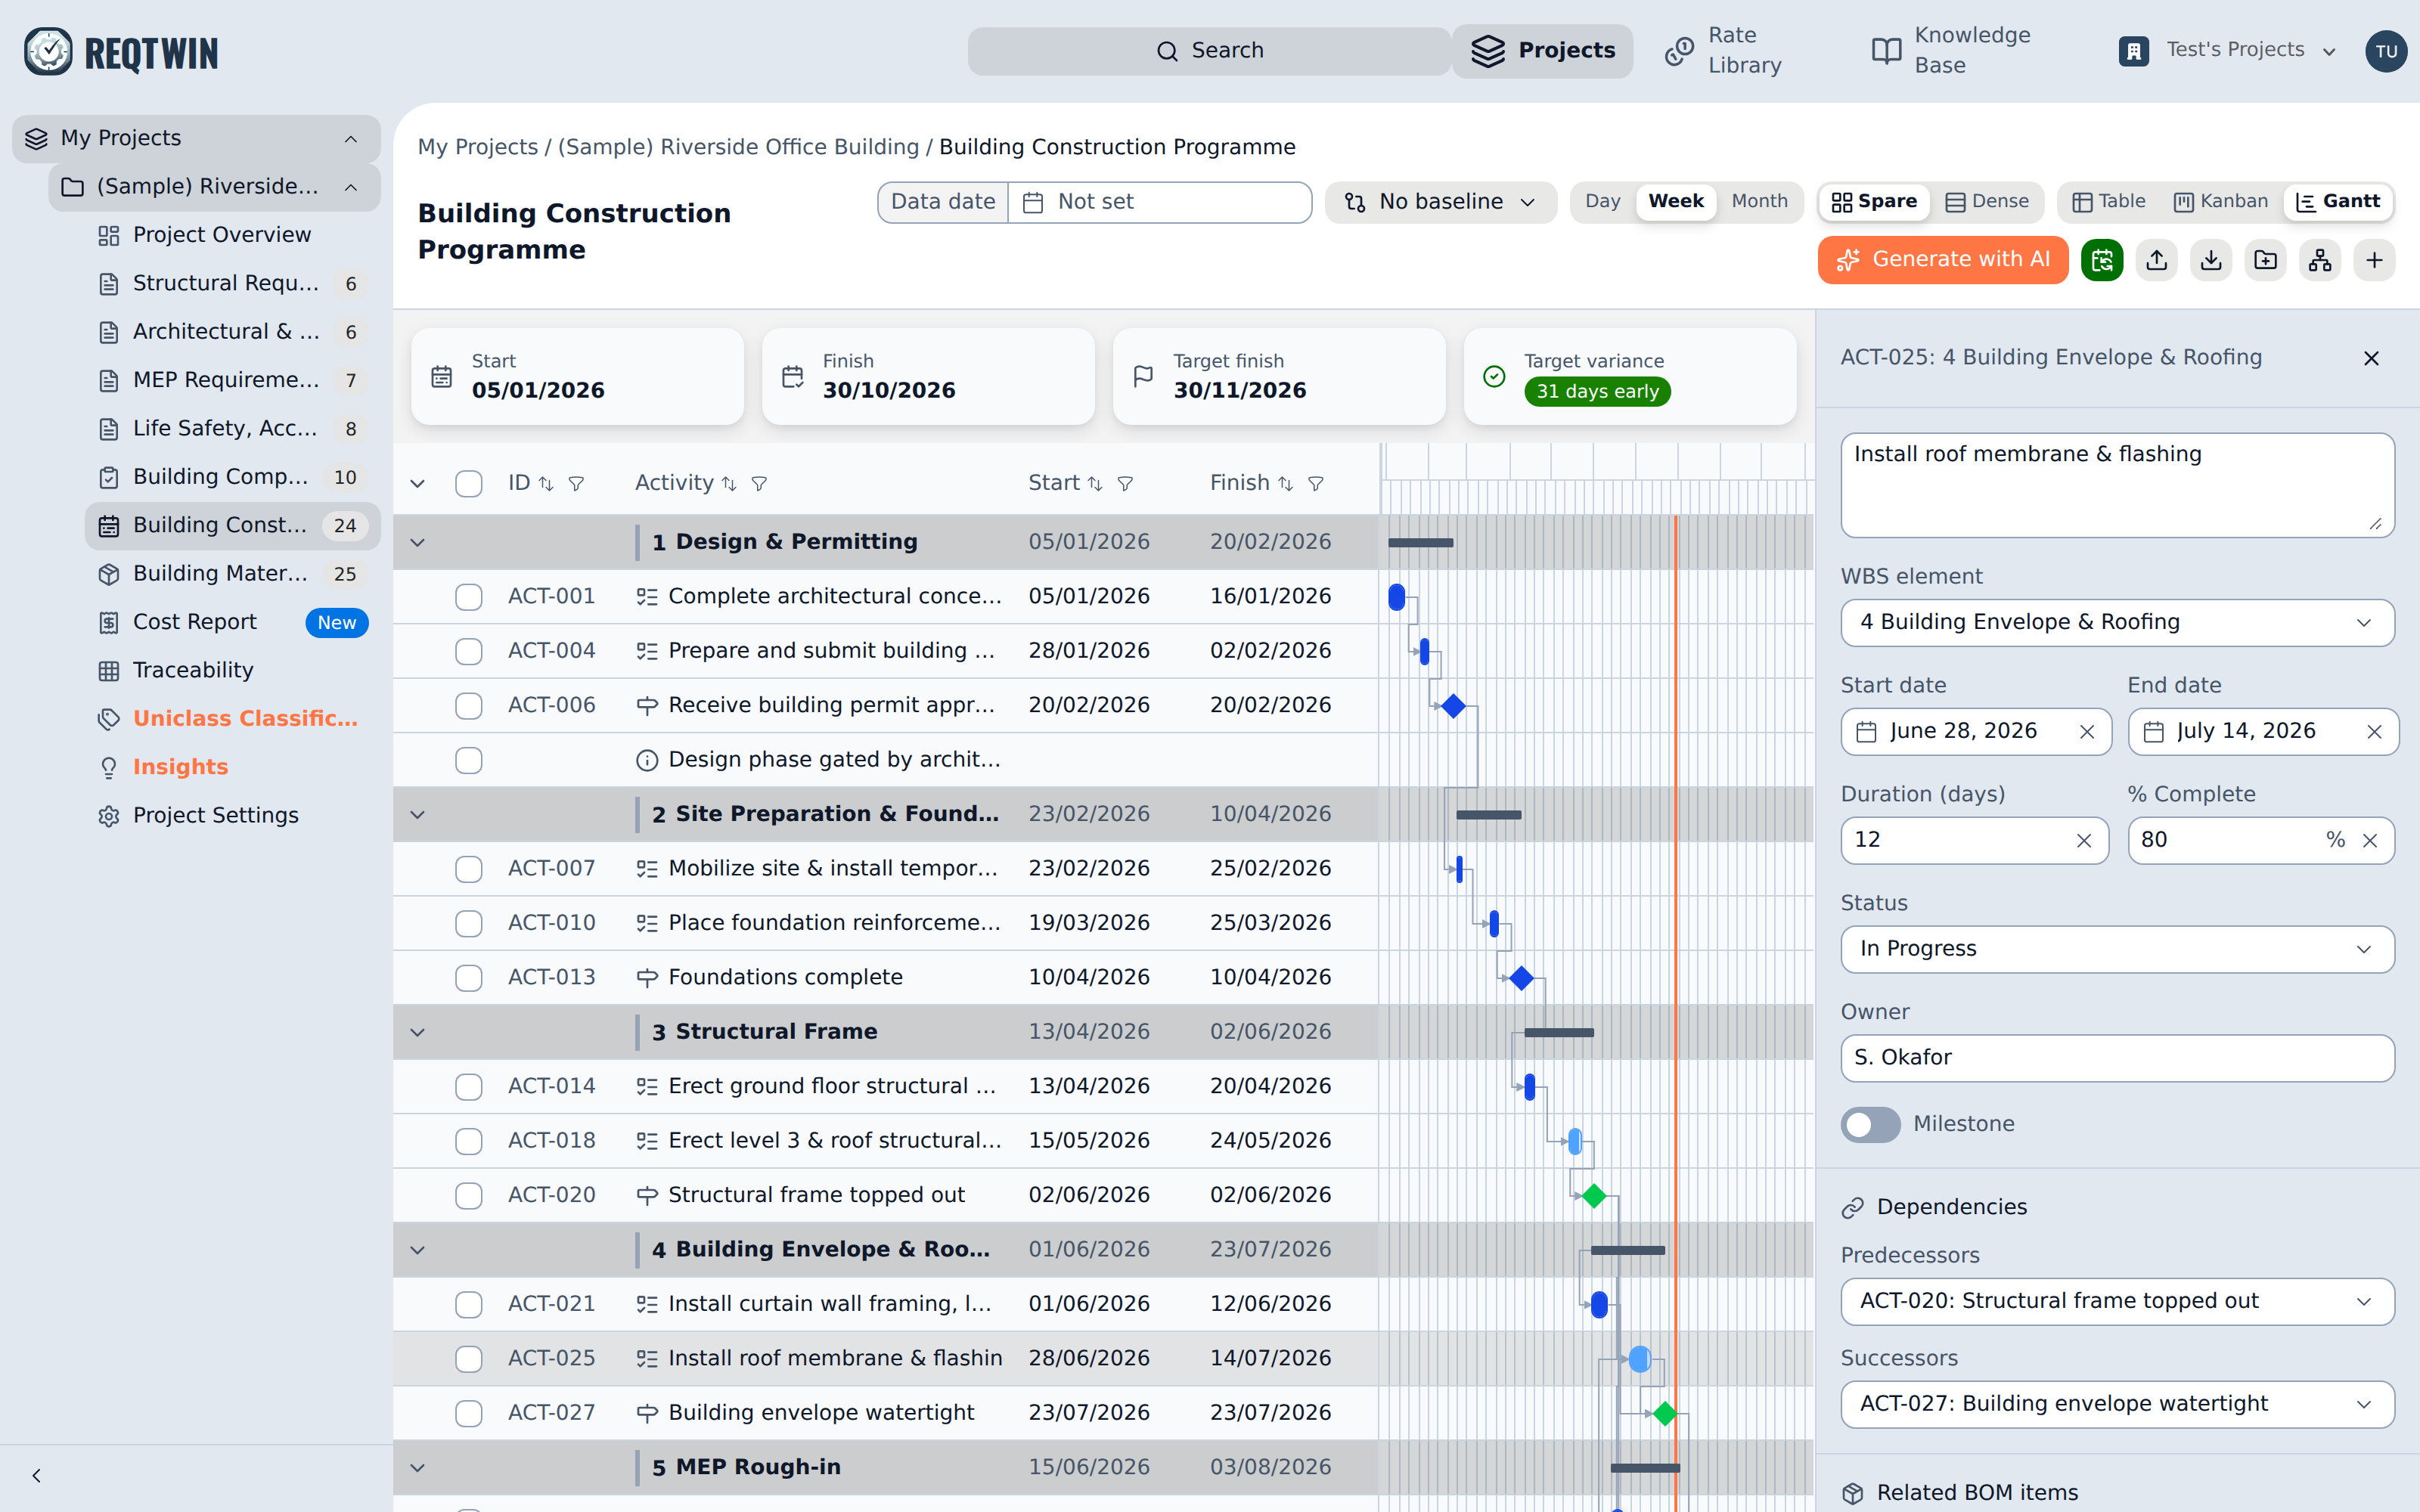
Selecting a bar opens the shared activity detail panel beside the chart.
Bars are not draggable. Dates move in the panel or through the Schedule button, never by hauling a bar across the calendar.